By Paddy Terry, Partner Success Manager
At Figured, we’ve been working alongside arable farmers and their advisers for some time now, and in that time we’ve seen the same challenging processes year after year - with accountants spending hours attempting to reconcile sales and inputs against various crops, and struggling to calculate income across multiple financial years when the harvest year doesn’t align. It's so often a prickly and painful process that ends up leaving the farmer with little understanding about the farm accounts, the accountant with little understanding about the farms cropping operation, and delayed access to crucial information for driving on farm decisions.
Recognising this, we set about building a new cropping experience that would allow the whole farming team to collaborate and contribute to both Figured and Xero, and tie all the information together in one easy to understand tool. This is where Figured’s arable experience was born from, and at the heart of this is the arable trackers - Crop Seasons.
Crop Seasons work like this - each crop you plant, or are planning to plant, will have its own crop season, and these function as profitability centres that house all the relevant information about that particular crop. Because we know harvest years and financial years rarely align, Crop Seasons keep all information about the crop in one place, regardless of the financial year - helping the whole farming team interpret the data more easily.
Track Crop Performance
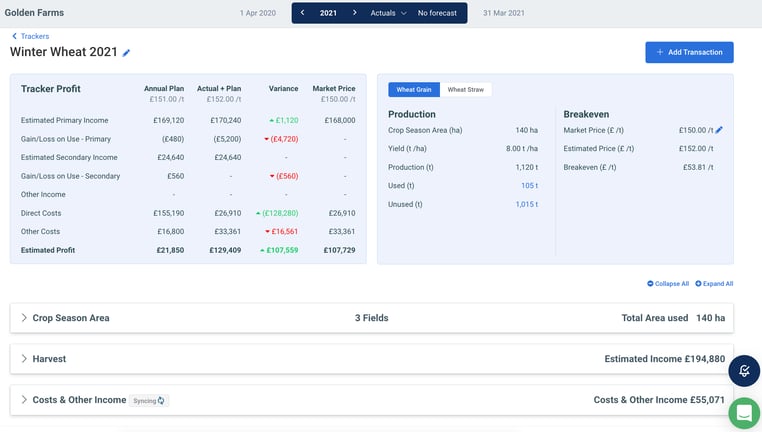
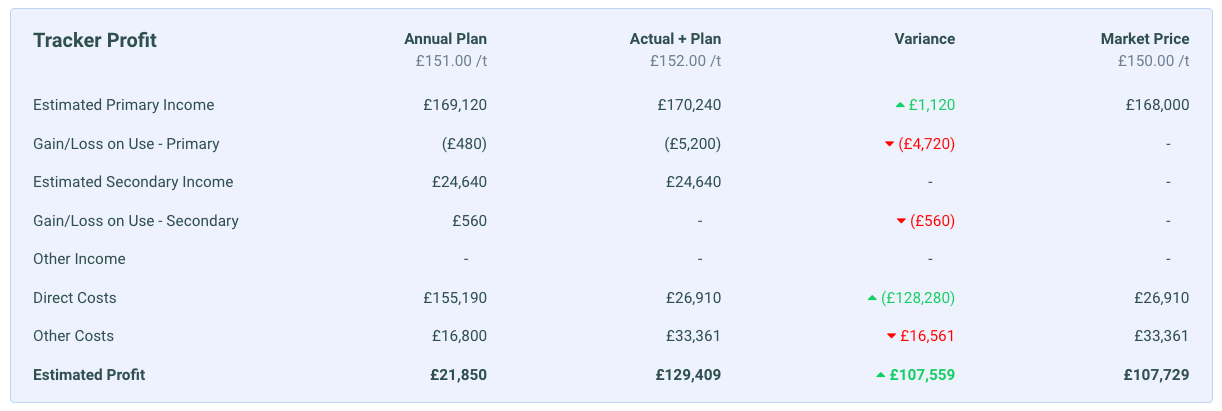
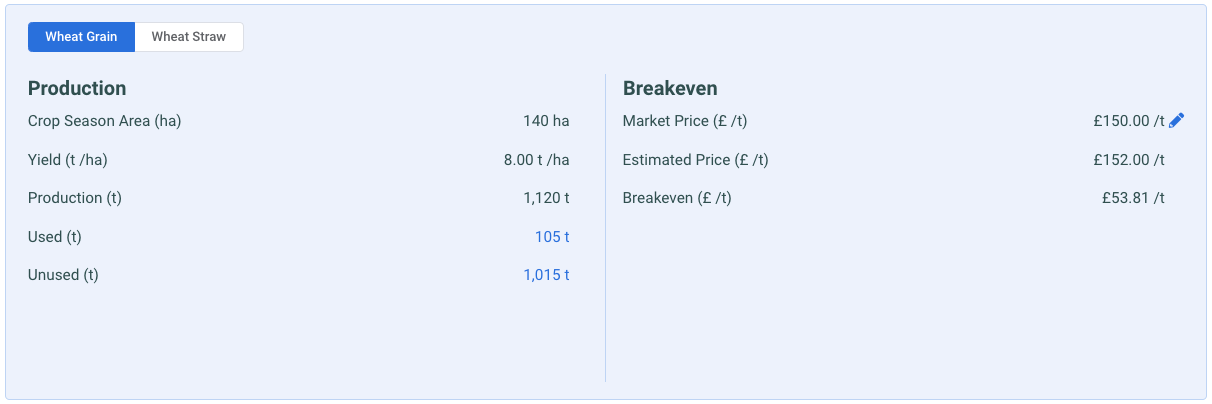
In the trackers themselves, we’ve summarised the key performance indicators at the top of each crop season so you don’t need to go trawling through data looking for the right information. On the left, you have your profitability breakdown, showing the variance between your annual plan (budget) and Actual + Plan (Actuals + forecasts), as well as an adjustable market price column to quickly model out price adjustments.
On the right, for each product being harvested you’ll see your yield and total production, including the breakdown of how much of that harvest has been used or not used. The Breakeven section gives you an accurate breakeven price based on your estimated price, as well as an adjustable market price.
Harvesting Crops & Tracking Inventory
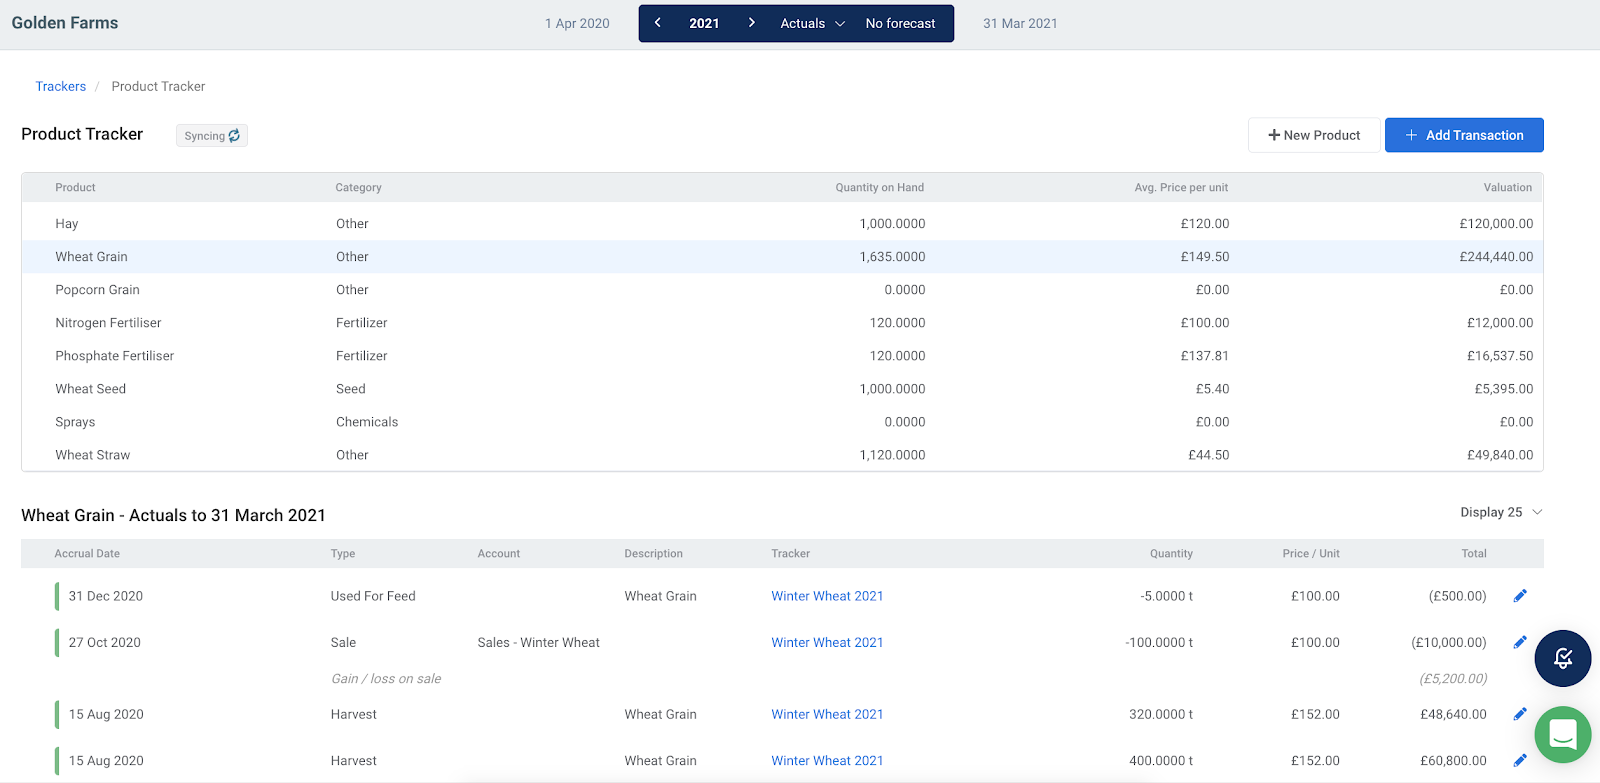
Key to how Crop Seasons work in Figured is our new inventory hub, the Product Tracker. This is where we keep track of both the arable inputs we have on hand, and the harvested outputs from our crops. Entering harvests through each crop season will flow through to the Product Tracker, where we can see all the movements of each product, as well as the valuation of what we have on hand - making inventory management practical and easy, and obtaining information for accounting purposes much more straightforward.
Accurate Cost Allocation
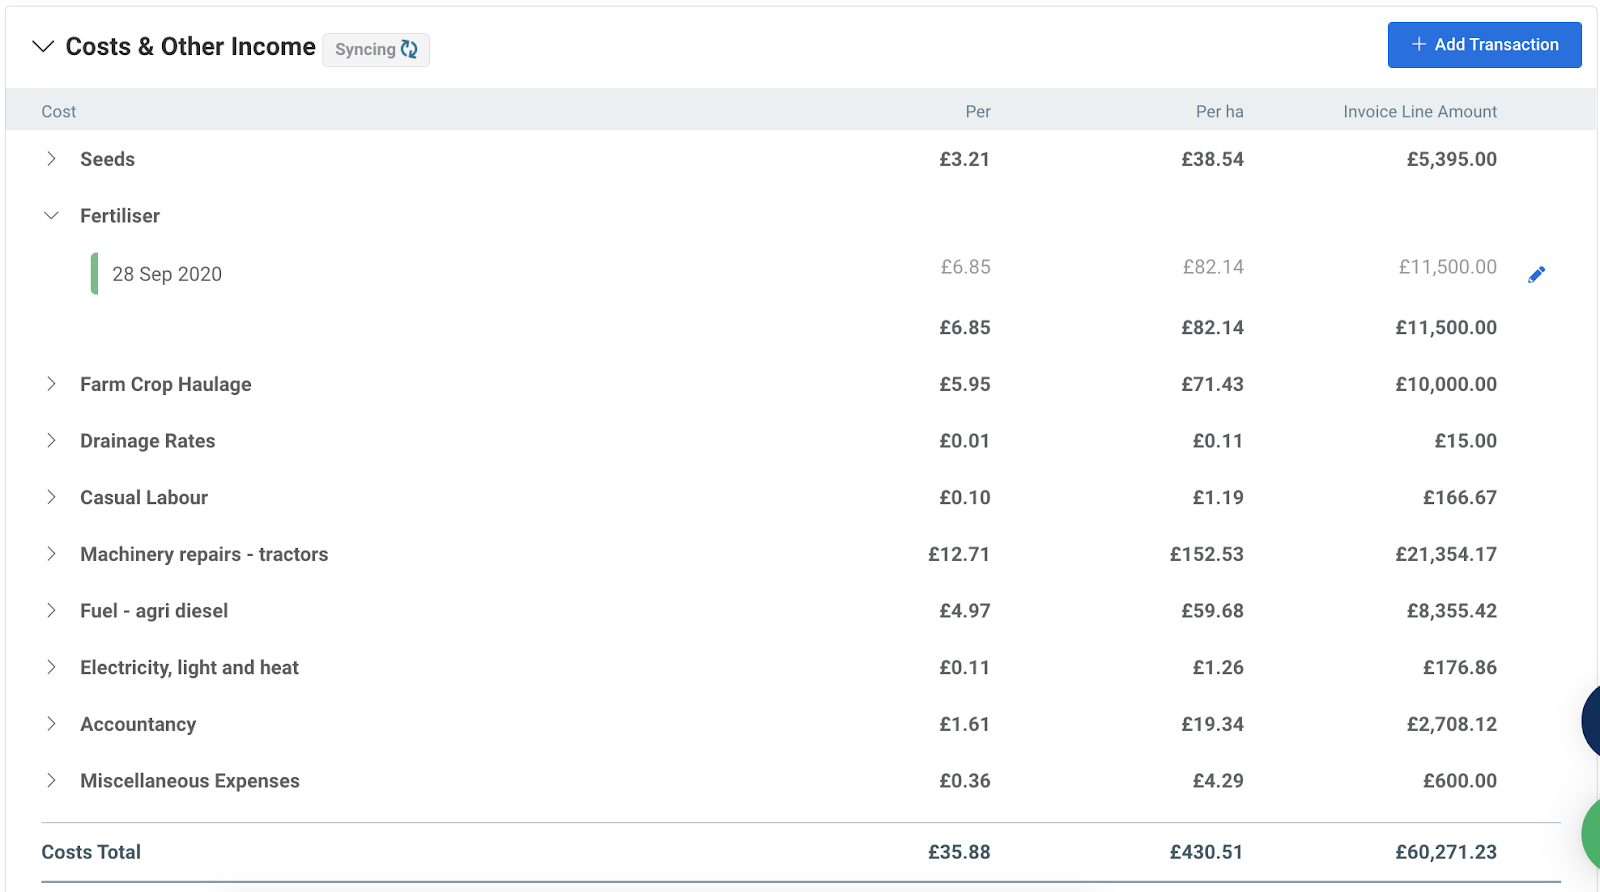
The value of Crop Seasons is nothing without having the right information in the right place, at the right time. Using Figured’s allocator tool to accurately allocate and split your Xero transactions between trackers means you can be as accurate as you’d like when applying costs to crops, making way for detailed gross margin reporting and an accurate cost of production. All of the costs and income are displayed in the tracker on an account basis, so it's easy to see the breakdown of allocated expenses and what costs were applied on what date, helping the team gain an understanding of what makes up the crop profitability.
Using Crop Seasons at the centre of Figured's arable experience provides us with the ability to analyse the profitability to the level of detail we need, be it in-depth analysis or a high level view, while providing clarity and transparency for the whole farming team. To find out more about Crop Seasons, check out the Figured Help Centre or reach out to us for a chat!