Introducing the Figured Advisor’s Dashboard:
Model, monitor, and address risk & opportunity across your entire client portfolio
Discover
The Advisor’s Dashboard & Figured platform for all your agri services
Figured Insights
Figured Insights
The ultimate practice tool for firms to unlock more value-added service opportunities.
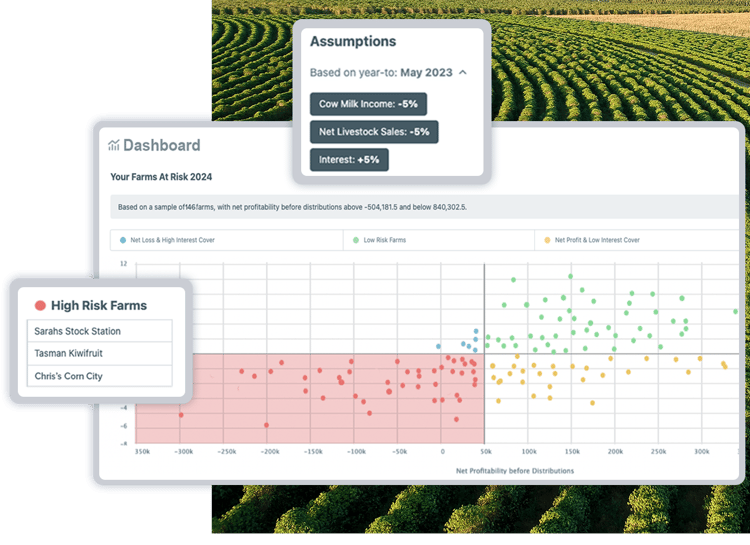
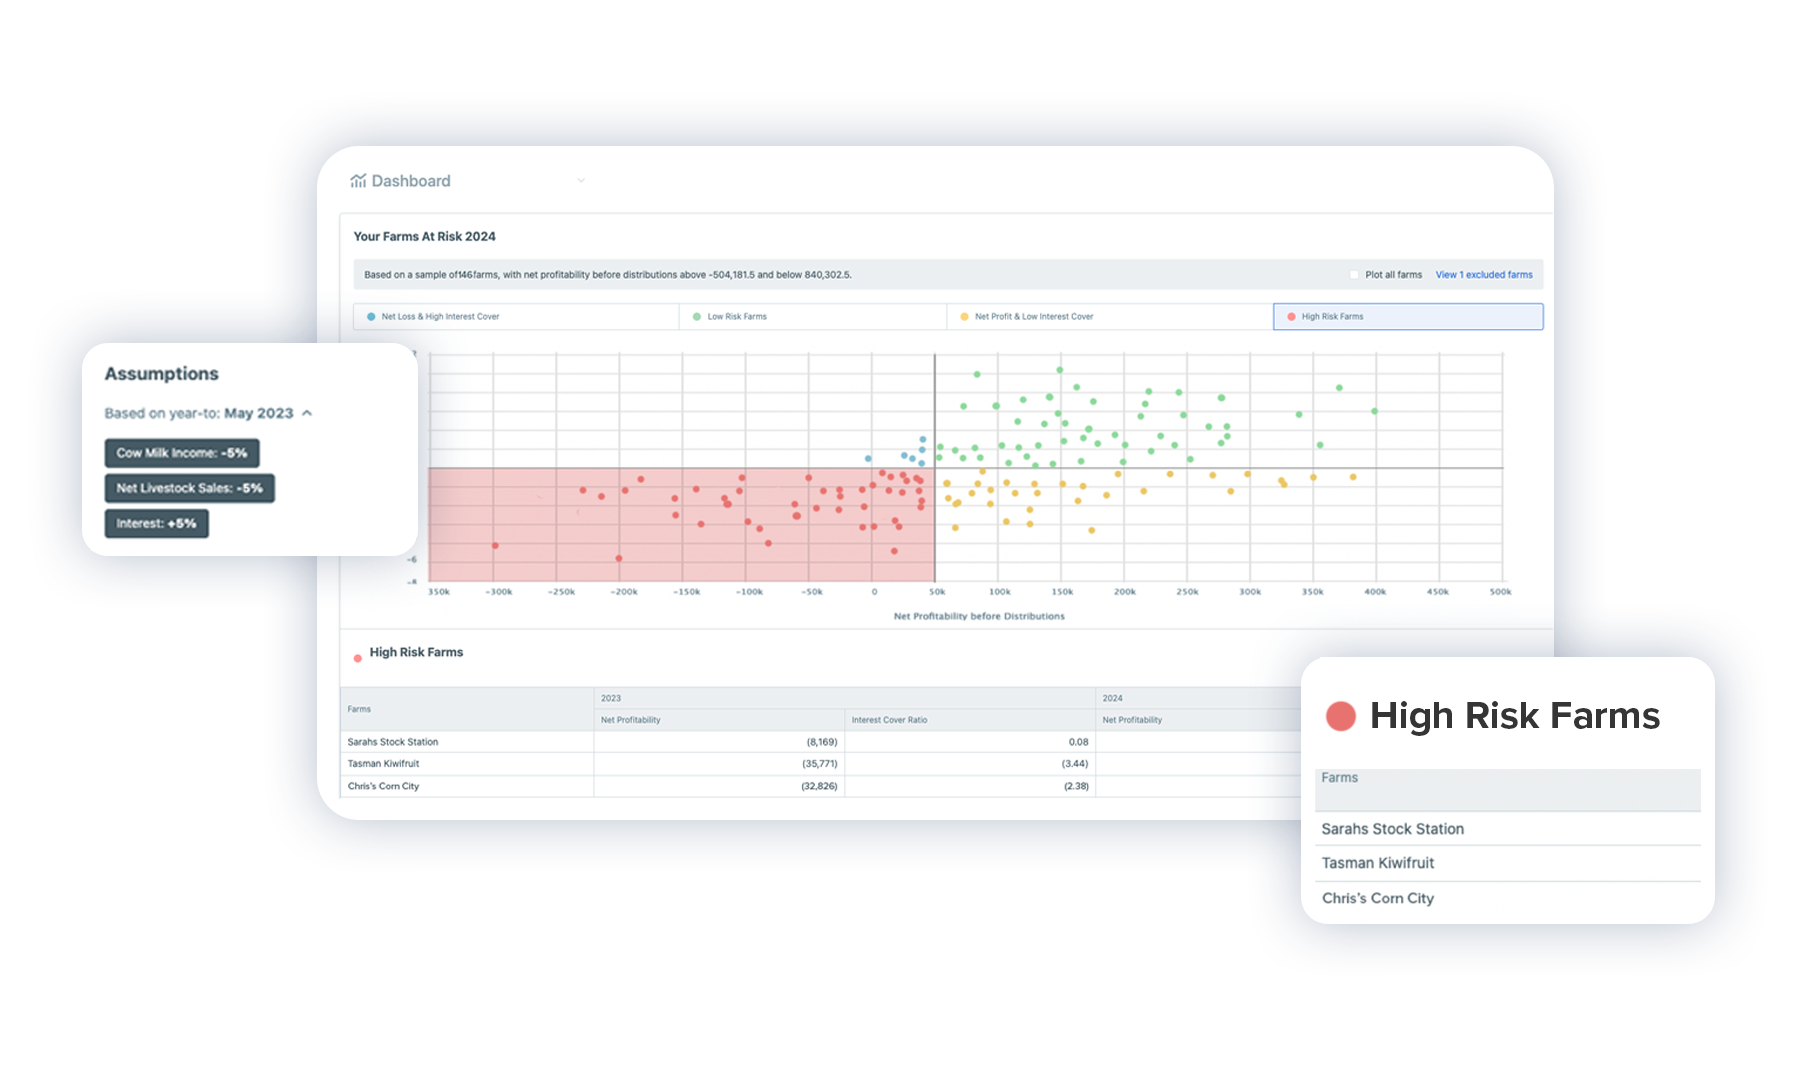
- The Figured Advisor’s Dashboard: Monitor your entire client portfolio through a dashboard view to identify clients facing risk or opportunities.
- Model changes in livestock or dairy prices across your portfolio and see which farms are most affected. For example, instantly see interest coverage ratios and identify those who are at risk.
Farm Manager
Farm Manager
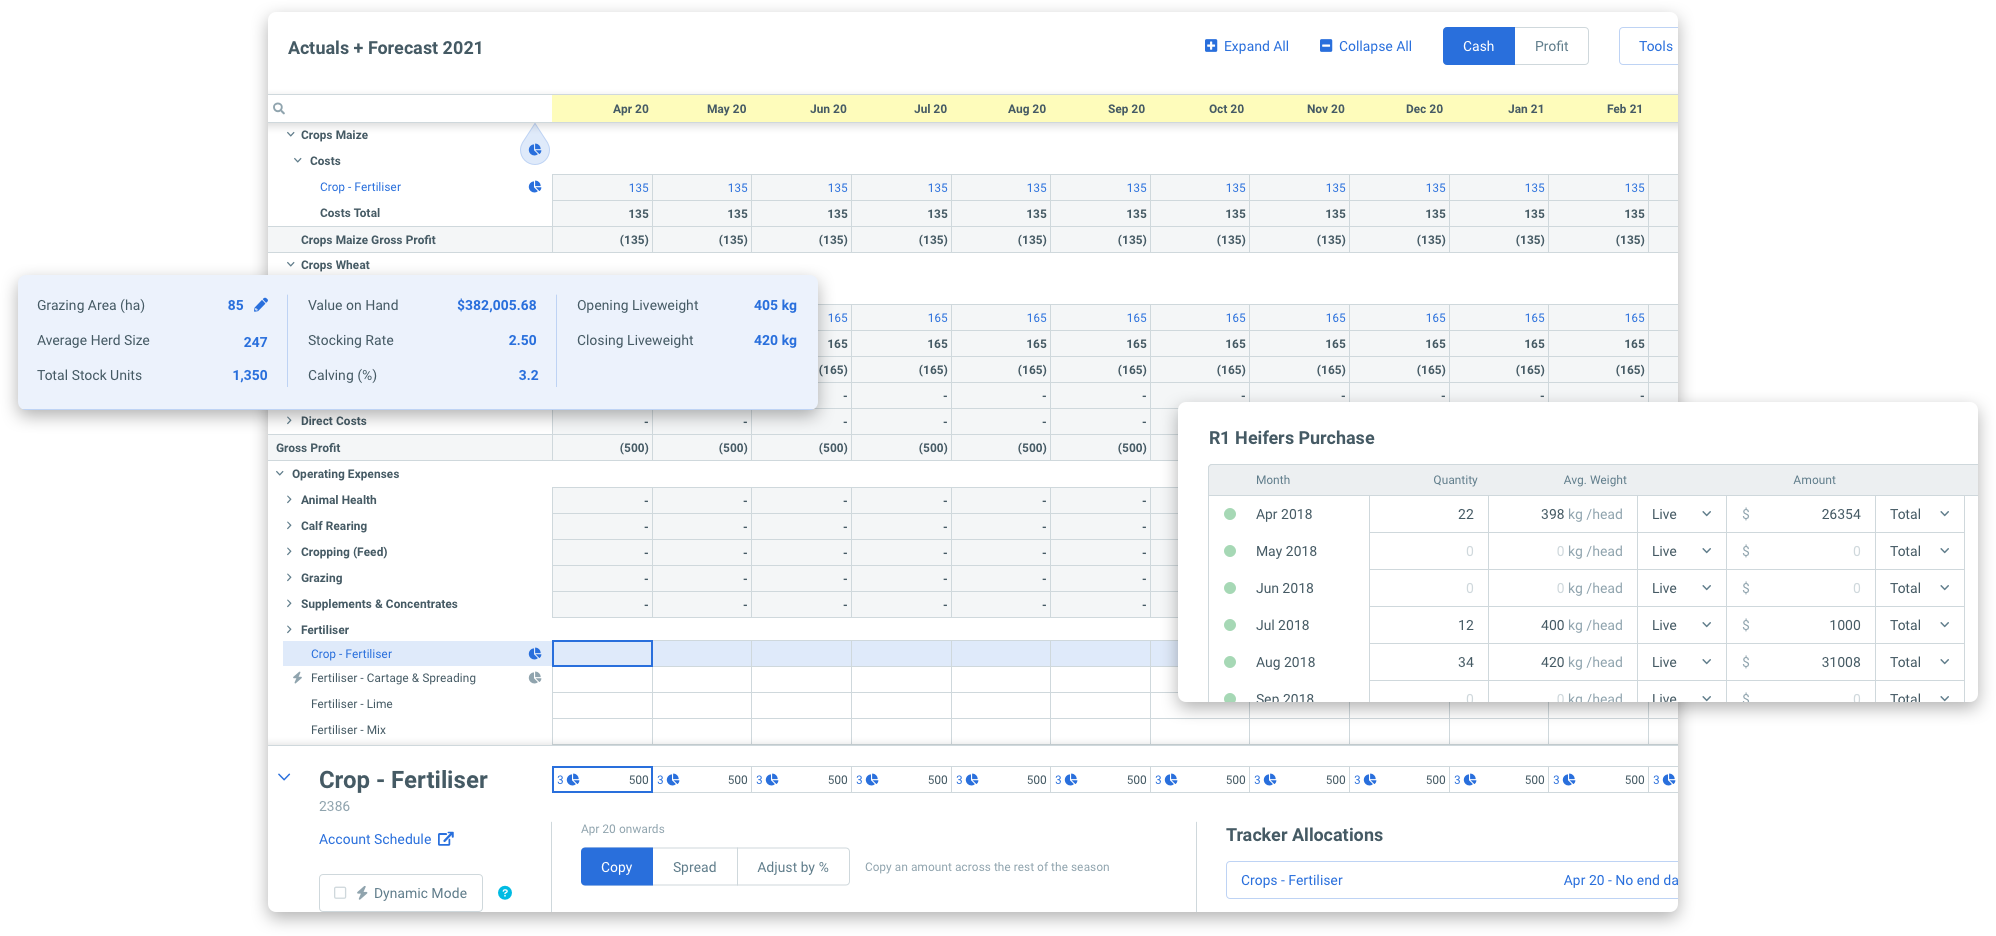
Powerful three-way month-by-month forecasting to scale planning services across all your farming clients.
- Create a budget, forecast, and annual plan for your clients with up-to-date financial and production data.
- Monitor variance on an ongoing basis, reforecast when needed, and make planning a year-round rather than a one-off opportunity with your clients as conditions and on-farm performance changes.
Farm Reporter
Farm Reporter
Agri-specific reporting that enables you to lay the foundation to scale high-value services across your portfolio.
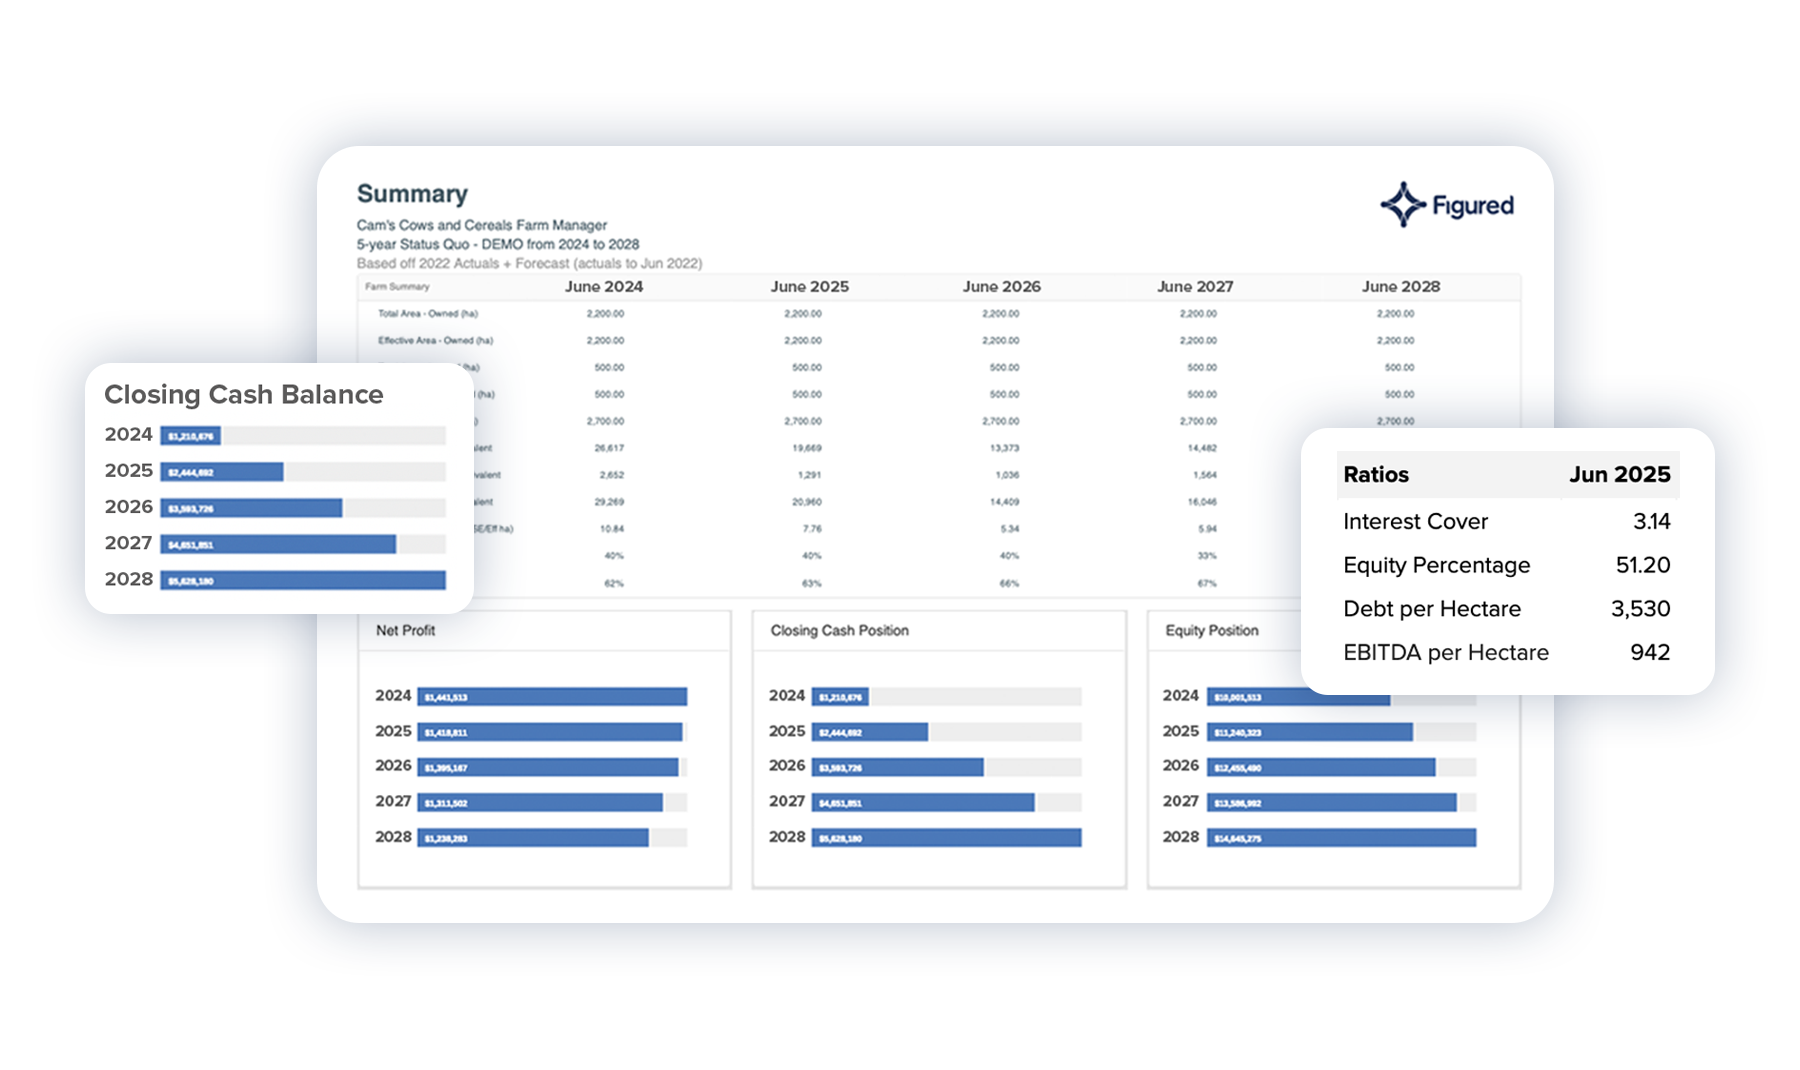
- Accessible scenario planning for all your agri clients. Easily model the impact of external factors like El Niño to give a clear view of what it means for them.
- Give clients the ability to look years into the future as well as the current season.
- Easily understand and report on farm performance across key ratios and KPIs.
- Prepare and report on Statement of Financial Position to provide guidance on equity and optionality.
Figured Insights
The ultimate practice tool for firms to unlock more value-added service opportunities.
- The Figured Advisor’s Dashboard: Monitor your entire client portfolio through a dashboard view to identify clients facing risk or opportunities.
- Model changes in livestock or dairy prices across your portfolio and see which farms are most affected. For example, instantly see interest coverage ratios and identify those who are at risk.
Farm Manager
Powerful three-way month-by-month forecasting to scale planning services across all your farming clients.
- Create a budget, forecast, and annual plan for your clients with up-to-date financial and production data.
- Monitor variance on an ongoing basis, reforecast when needed, and make planning a year-round rather than a one-off opportunity with your clients as conditions and on-farm performance changes.
Farm Reporter
Agri-specific reporting that enables you to lay the foundation to scale high-value services across your portfolio.
- Accessible scenario planning for all your agri clients. Easily model the impact of external factors like El Niño to give a clear view of what it means for them.
- Give clients the ability to look years into the future as well as the current season.
- Easily understand and report on farm performance across key ratios and KPIs.
- Prepare and report on Statement of Financial Position to provide guidance on equity and optionality.
Get in touch & start using the full extent of the Figured Advisor’s Dashboard to scale your agri-planning services.

"The increased collaboration with our clients gives us a greater depth and knowledge of their goals and what they’re seeking to achieve."

"Figured is a great tool for financial management reporting because it really allows the opportunity for us to help clients establish a great structure around their financial reporting system that actually gives them meaningful information."

“With Figured and cloud accounting software working together, we can see where things will end up in 5-to-10 years. You’ve got real numbers and good reports, and it gives farmers something to think about and tangible to work on.”