By Forsyth Thompson
Industry benchmarks have been an important part of our industry for some time, whether national or ones you’ve been building yourselves, and they can directly influence on-farm decisions. But for years, there have been two significant challenges which we’ve all accepted as just being “how it is.”
1. Timing: In an industry as volatile as dairy has become, and when seasons can differ so much from the previous ones, benchmarks that are 12 months (and longer) old are not really what anyone would want—they’re just all we could get. Why? Because there was simply no way to get anything faster.
2. Cost: Many top firms went down the route of producing their own benchmarks using a range of formats and approaches. One consistent theme in all of them, though, is cost—the cost in time and effort to put these together. And of course, that isn’t unrelated to the timing challenge either.
Figured reimagined this. With more than half of all NZ dairy farms on the Figured platform (representing more than 1bn kg/MS), and with updated financial and production data for these farms, we are uniquely placed to solve this and provide you and your farmers, with what you really want.
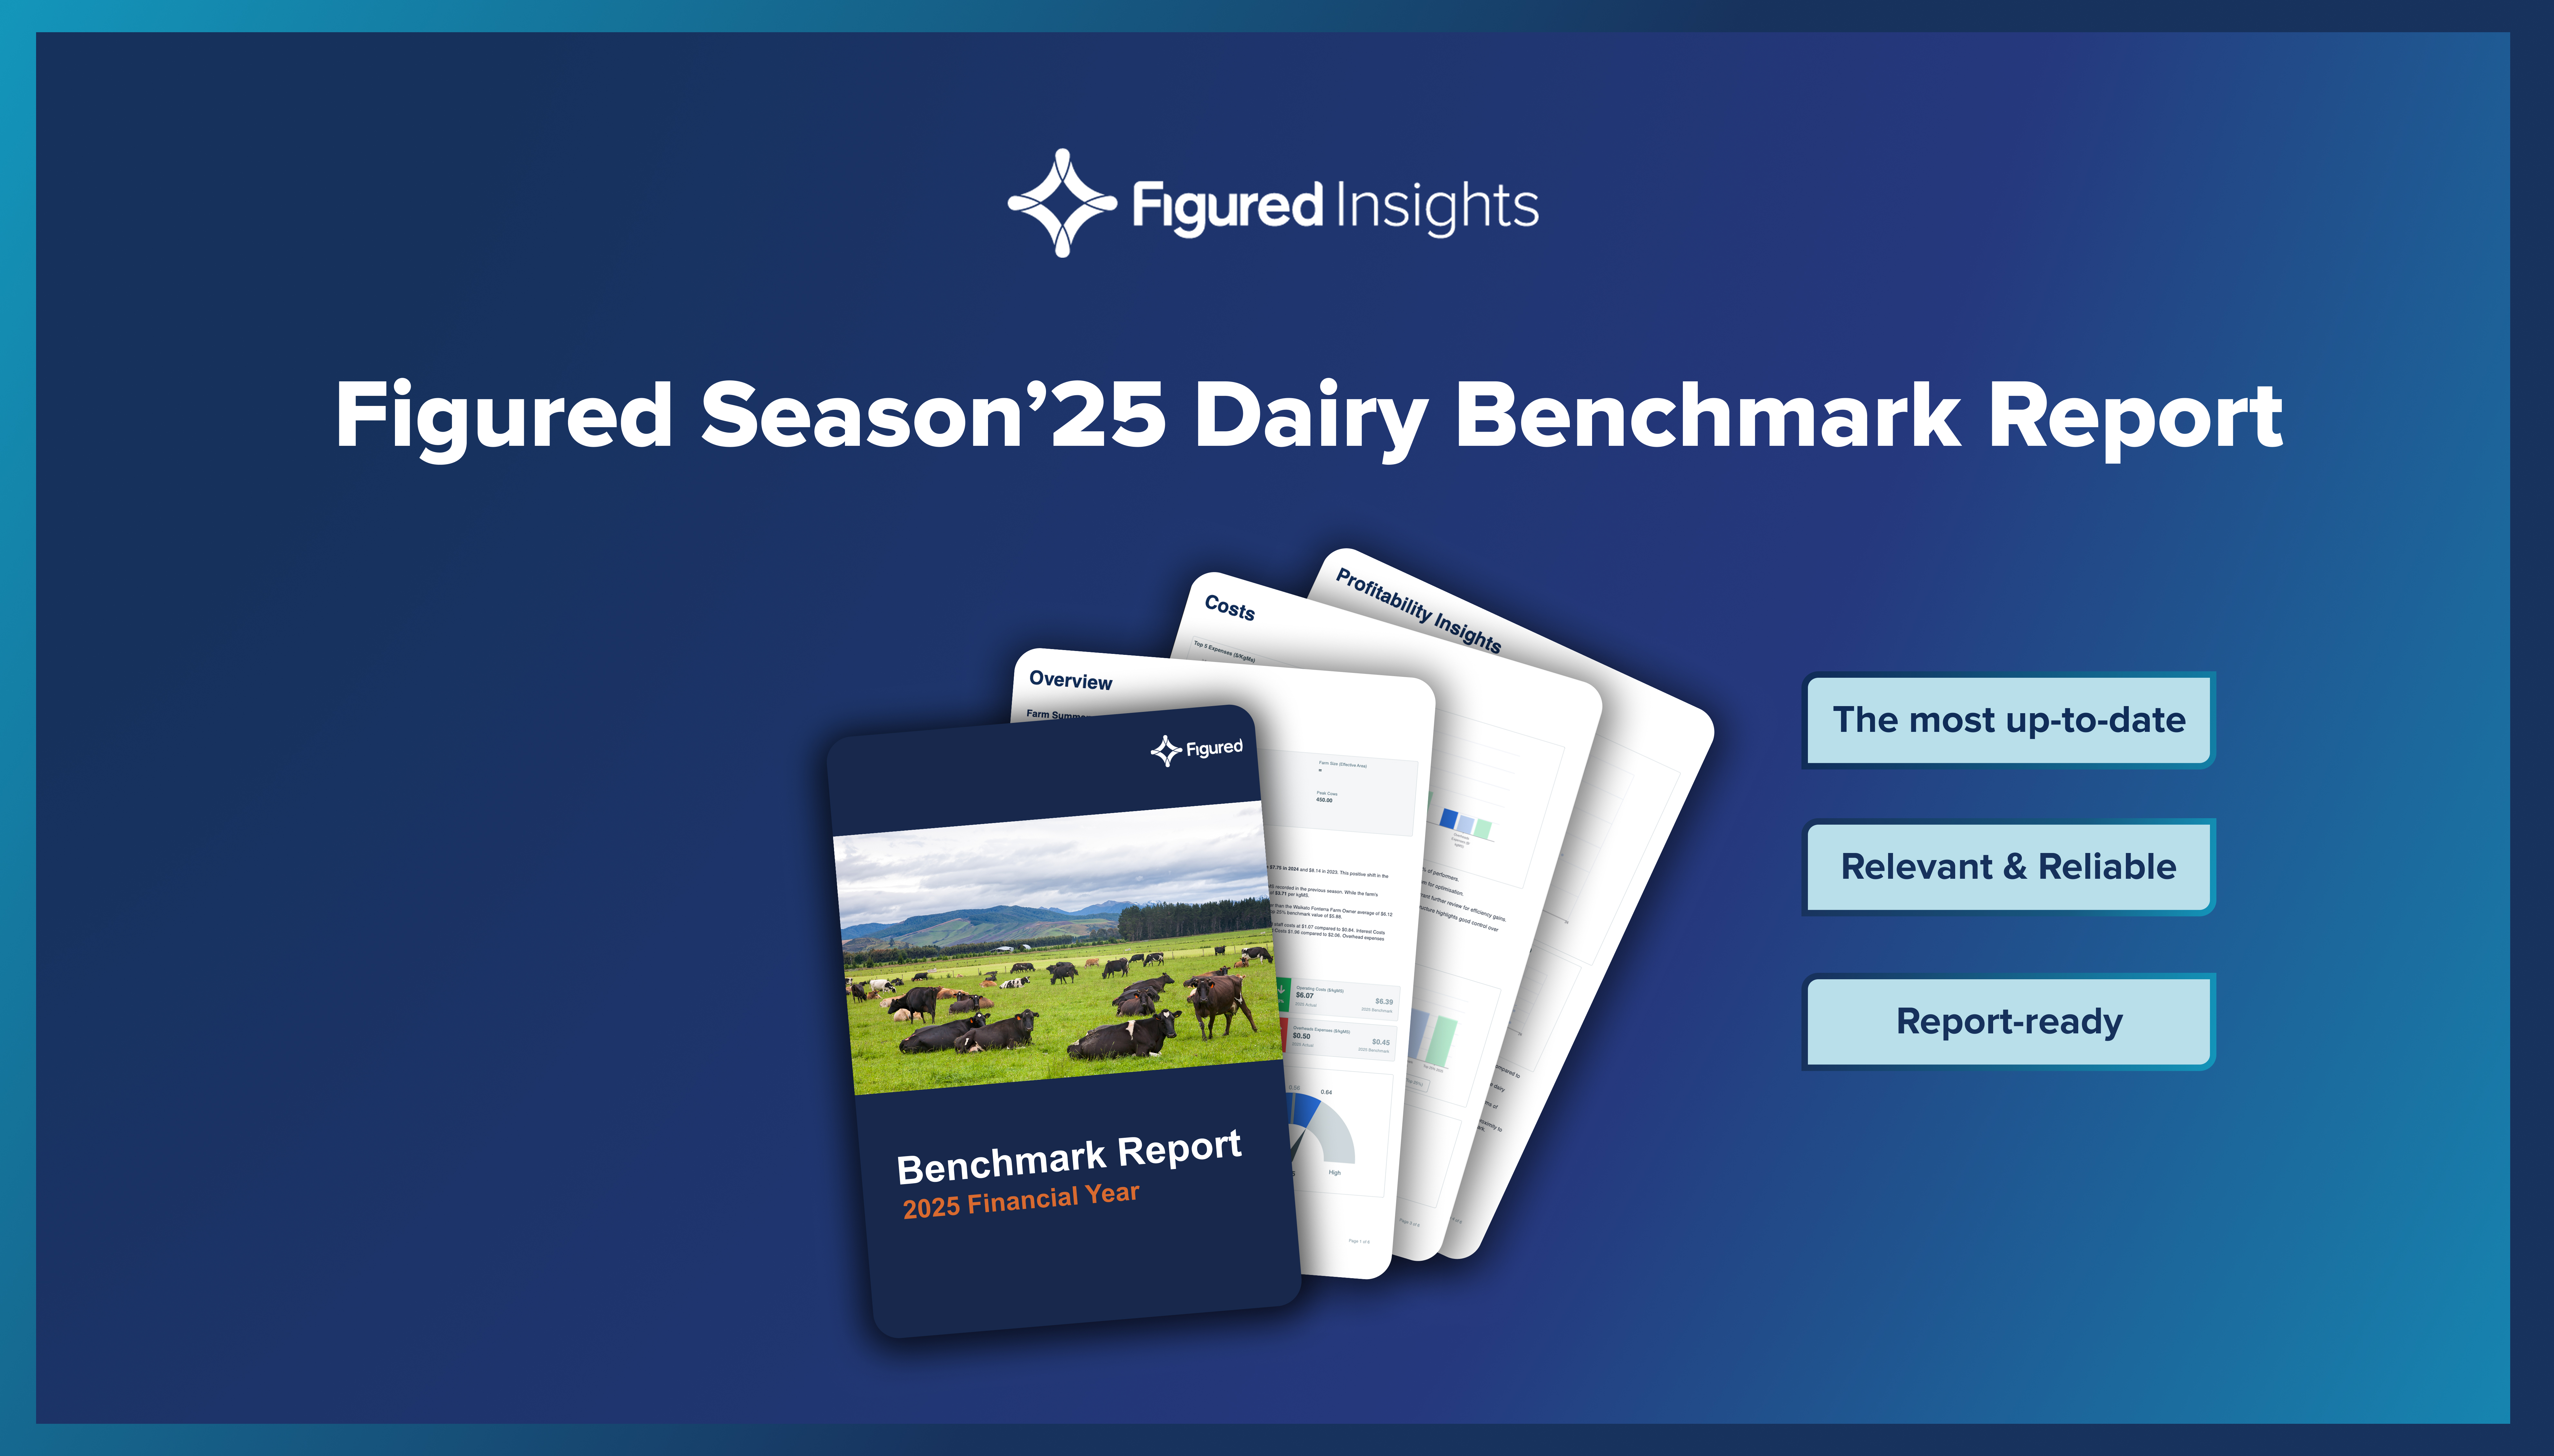
 Season 25 national, regional & supplier benchmarks are now available to you on the Figured platform.
They are based on real, not forecasted, data from the 2024/25 season and delivered exactly when they’re most useful: right now. Not only are they timely and relevant, they’re instantly available for each farm, in their file, giving you the information you need when you need it, where you need it.
And we’ve added one more feature to our benchmarking to make it even more relevant for you and for your farmers.
Having an average is great, and having the top quartile within that even more so, but we’ve gone further than that and brought in not just national and regional averages but supplier ones too, to give you more relevancy than ever. Averages are still just averages, though. What we’ve added to Figured Dairy Benchmarking is the ability to see exactly where one particular farm sits within the total distribution of farms you’re comparing them with.
You and your farmers have told us that you want benchmarking to reflect what’s happening now — not what was happening 12 months ago. Figured Benchmarking delivers exactly that.
Farmers are getting better access to benchmark data through new integrations like Farm Focus + DairyBase — but it’s still the same data everyone else has had for months. When your farmer client can pull 2023 benchmarks themselves, but you’re showing up with 2025 insights, that’s not just a timing advantage. That’s you doing something they literally cannot do themselves.
Figured Benchmarking isn’t about matching what farmers can access.
It’s about staying ahead of it.

