
Time back in your practice
One template. Every farm. No reformatting, no rebuilding, no starting from scratch

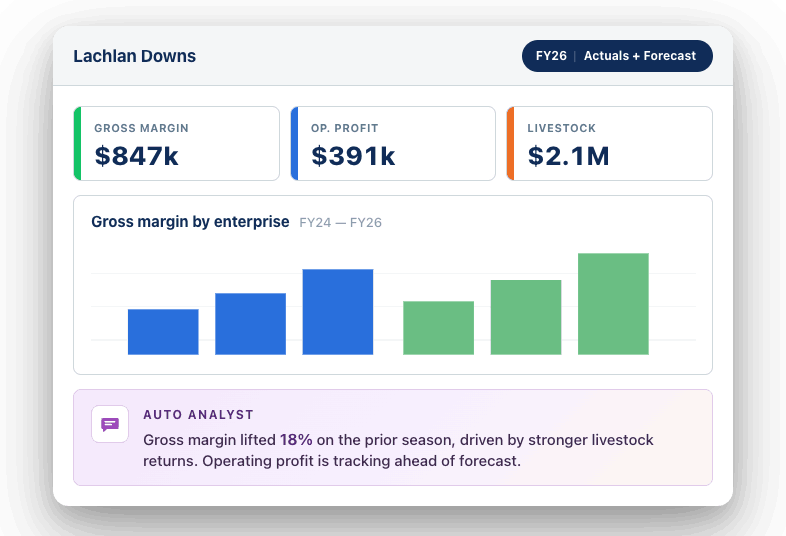
Reports clients understand
Clear, visual, and easily interpreted insights with AI commentary

Your metrics, your way
KPI tiles, charts and flexible columns. Build exactly what that farm and that conversation needs.

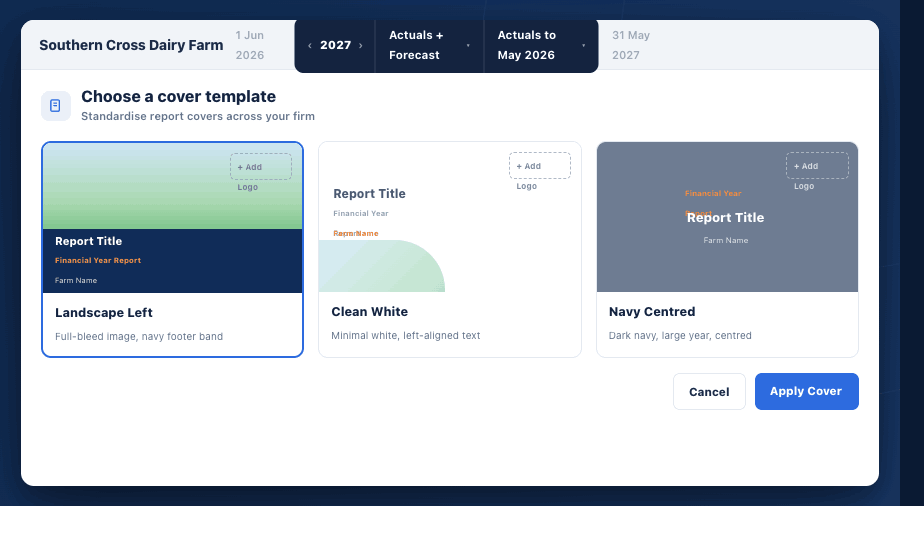
Your brand, every report
Your logo, your colours, your cover page. Every report looks like it came from your firm.

More clients, same capacity
Compliance, advisory or somewhere in between, Reporting Studio scales with your practice.

Formula Builder
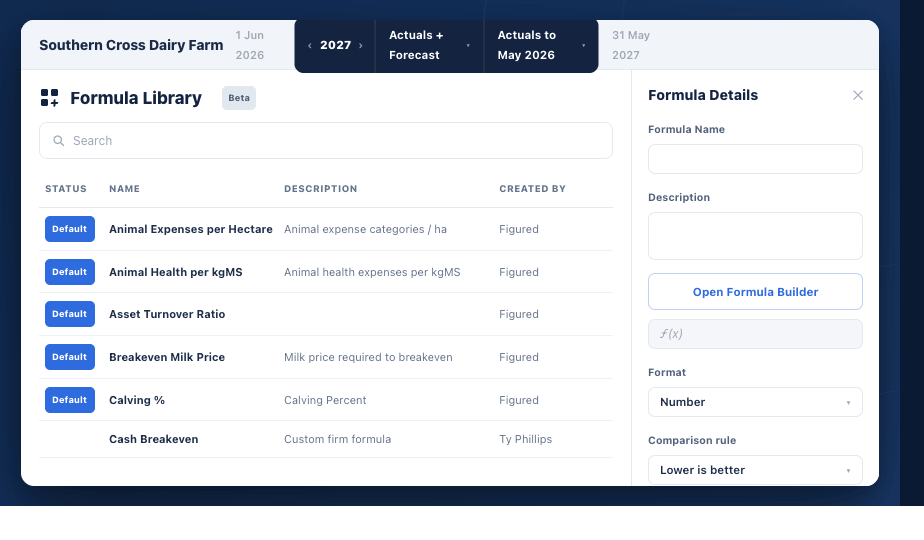
Build, standardise, and share KPIs across your firm.
→ See exactly how default Figured formulas are calculated.
→ Build your own metrics using live farm data from Figured.
→ Create firm-level KPIs to ensure consistency across your practice.
Custom Reports
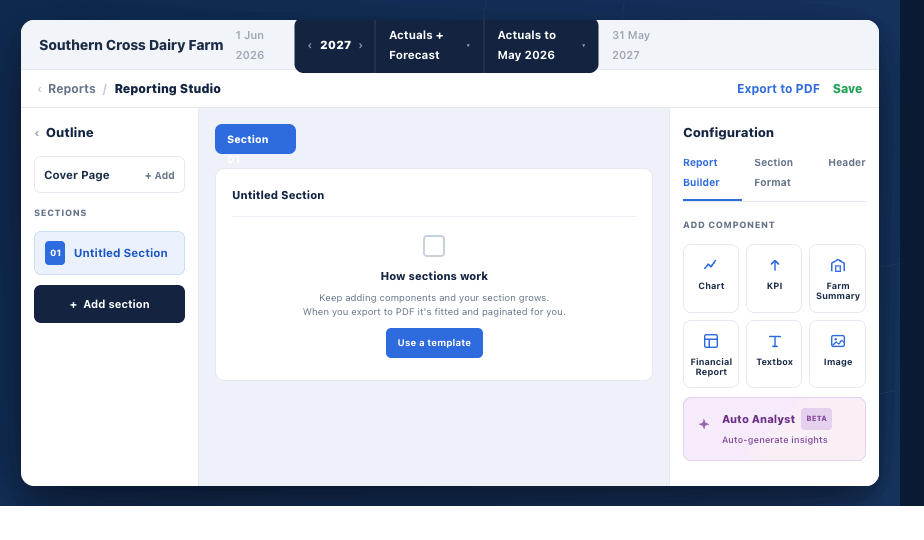
Generate tailored, engaging outputs that bring insights to life.
→ Start from a template or create your own report from scratch.
→ Customise layout and add charts, commentary, images, and branding.
→ Combine multiple production and financial reports in one view.
→ Instantly pull in your formulas, KPIs, and live data.
Org-Level Templates
Standardise custom reports to ensure quality and efficiency at scale.
→ Turn custom reports into reusable templates for your firm.
→ Maintain consistent structure and quality across all outputs.
→ Roll out quarterly reviews, bank packs, or management summaries in minutes.
Auto Analyst
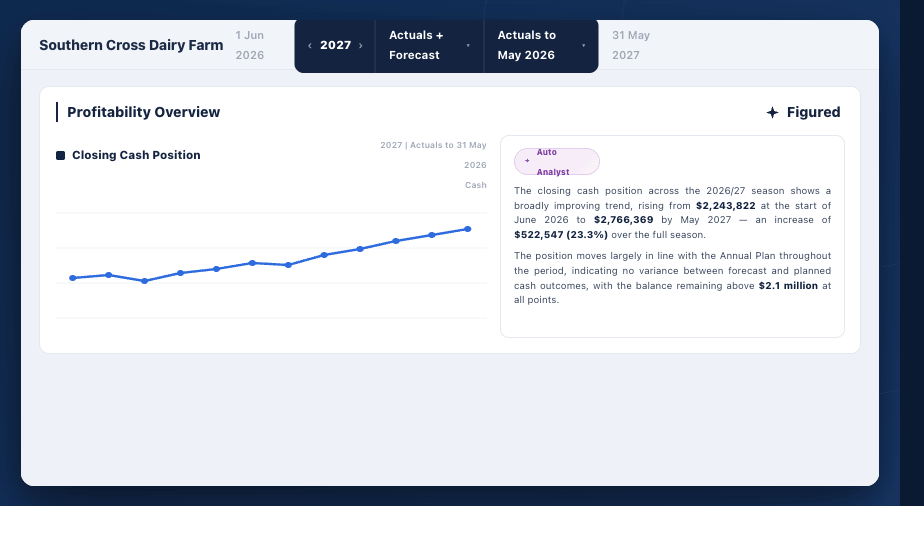
AI commentary that writes itself.
→ Reads the numbers on the page and writes the narrative for you.
→ Configured once at org level. Personalised for every farm, every report.
→ Choose your format — executive summary, detailed analysis, or bullet points.
→ Edit any time, or let it run.
Drag and Drop Builder
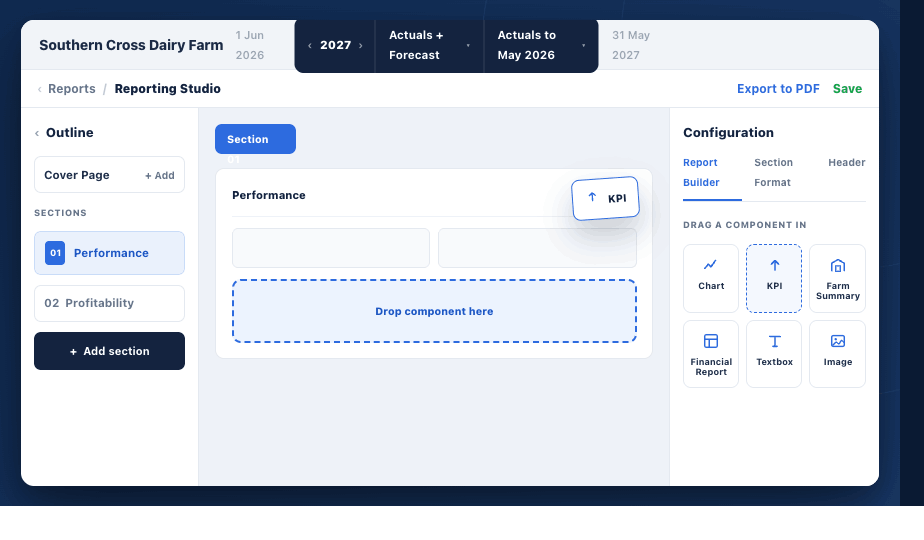
Six components. One canvas. Build exactly what your client needs.
→ Chart — bar, line, stacked, comparison.
→ KPI — headline numbers, delta, comparison.
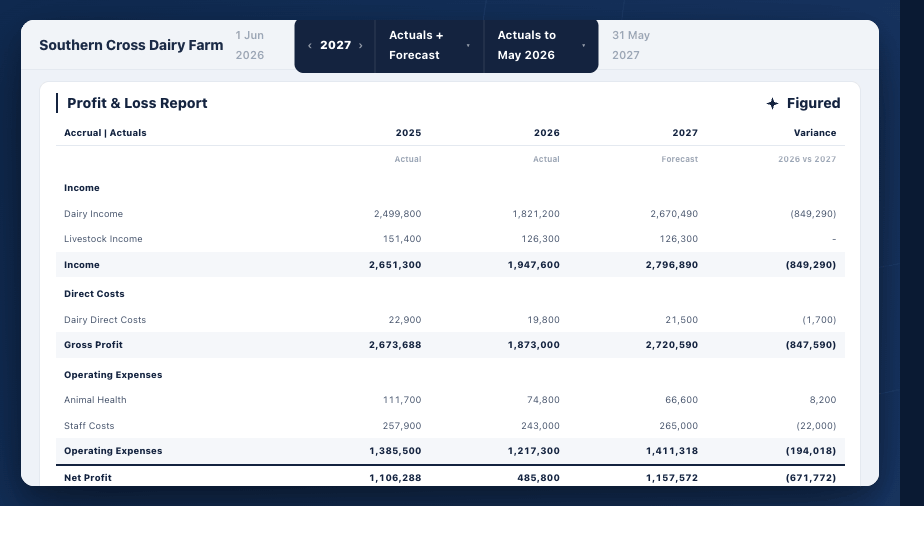
→ Financial Report — P&L, Balance Sheet, Cash Flow.
→ Farm Summary — the farm's own facts, anchored.
→ Textbox — notes, context, narrative.
→ Image — farm photo, logo, brand mark.
KPI Tiles
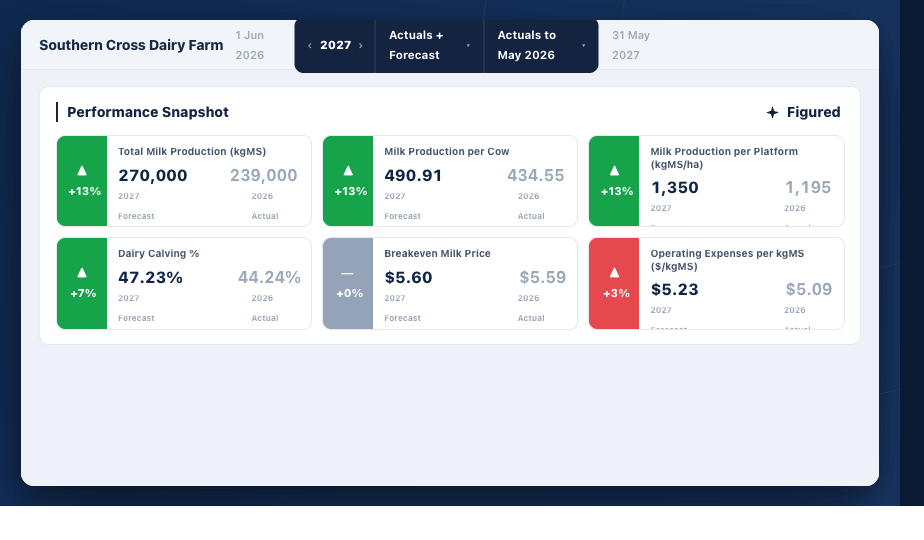
The numbers that matter most to that farm and that conversation.
→ Choose from Figured's default library or build your own using the Formula Builder.
→ Gross margin per hectare, operating surplus per kgMS, cost of production per tonne.
→ Place them anywhere in the report.
→ Set once at org level and they populate automatically for every farm.
Flexible Columns
Build the column structure that fits the conversation.
→ Add variance, production ratios, historical averages, and custom date ranges.
→ Rename columns to suit each client — "Season to date", "Budget".
→ Drag rows and columns into any order.
→ Build it once at org level and it applies across every client.
Build, standardise, and share KPIs across your firm.
→ See exactly how default Figured formulas are calculated.
→ Build your own metrics using live farm data from Figured.
→ Create firm-level KPIs to ensure consistency across your practice.
Generate tailored, engaging outputs that bring insights to life.
→ Start from a template or create your own report from scratch.
→ Customise layout and add charts, commentary, images, and branding.
→ Combine multiple production and financial reports in one view.
→ Instantly pull in your formulas, KPIs, and live data.
Standardise custom reports to ensure quality and efficiency at scale.
→ Turn custom reports into reusable templates for your firm.
→ Maintain consistent structure and quality across all outputs.
→ Roll out quarterly reviews, bank packs, or management summaries in minutes.
AI commentary that writes itself.
→ Reads the numbers on the page and writes the narrative for you.
→ Configured once at org level. Personalised for every farm, every report.
→ Choose your format — executive summary, detailed analysis, or bullet points.
→ Edit any time, or let it run.
Six components. One canvas. Build exactly what your client needs.
→ Chart — bar, line, stacked, comparison.
→ KPI — headline numbers, delta, comparison.
→ Financial Report — P&L, Balance Sheet, Cash Flow.
→ Farm Summary — the farm's own facts, anchored.
→ Textbox — notes, context, narrative.
→ Image — farm photo, logo, brand mark.
The numbers that matter most to that farm and that conversation.
→ Choose from Figured's default library or build your own using the Formula Builder.
→ Gross margin per hectare, operating surplus per kgMS, cost of production per tonne.
→ Place them anywhere in the report.
→ Set once at org level and they populate automatically for every farm.
Build the column structure that fits the conversation.
→ Add variance, production ratios, historical averages, and custom date ranges.
→ Rename columns to suit each client — "Season to date", "Budget".
→ Drag rows and columns into any order.
→ Build it once at org level and it applies across every client.
-1.png)
Classic Reports |
Reporting Studio |
|
|---|---|---|
| Ideal for | Repeatable compliance tasks and financial reporting. |
Bespoke advisory, management, and planning conversations. |
| What you get | Standardised financial reports. |
Easy-to-interpret, visually appealing reports highlighting farm-specific insights. |
Farm-level templates |
||
Org-level templates |
||
Out-of-the-box templates |
||
Flexible layouts |
||
Custom-built KPIs |
||
Multiple production and financial reports in one view |