The world's first on-demand financial insights and predictive modelling tool
for the agricultural sector.

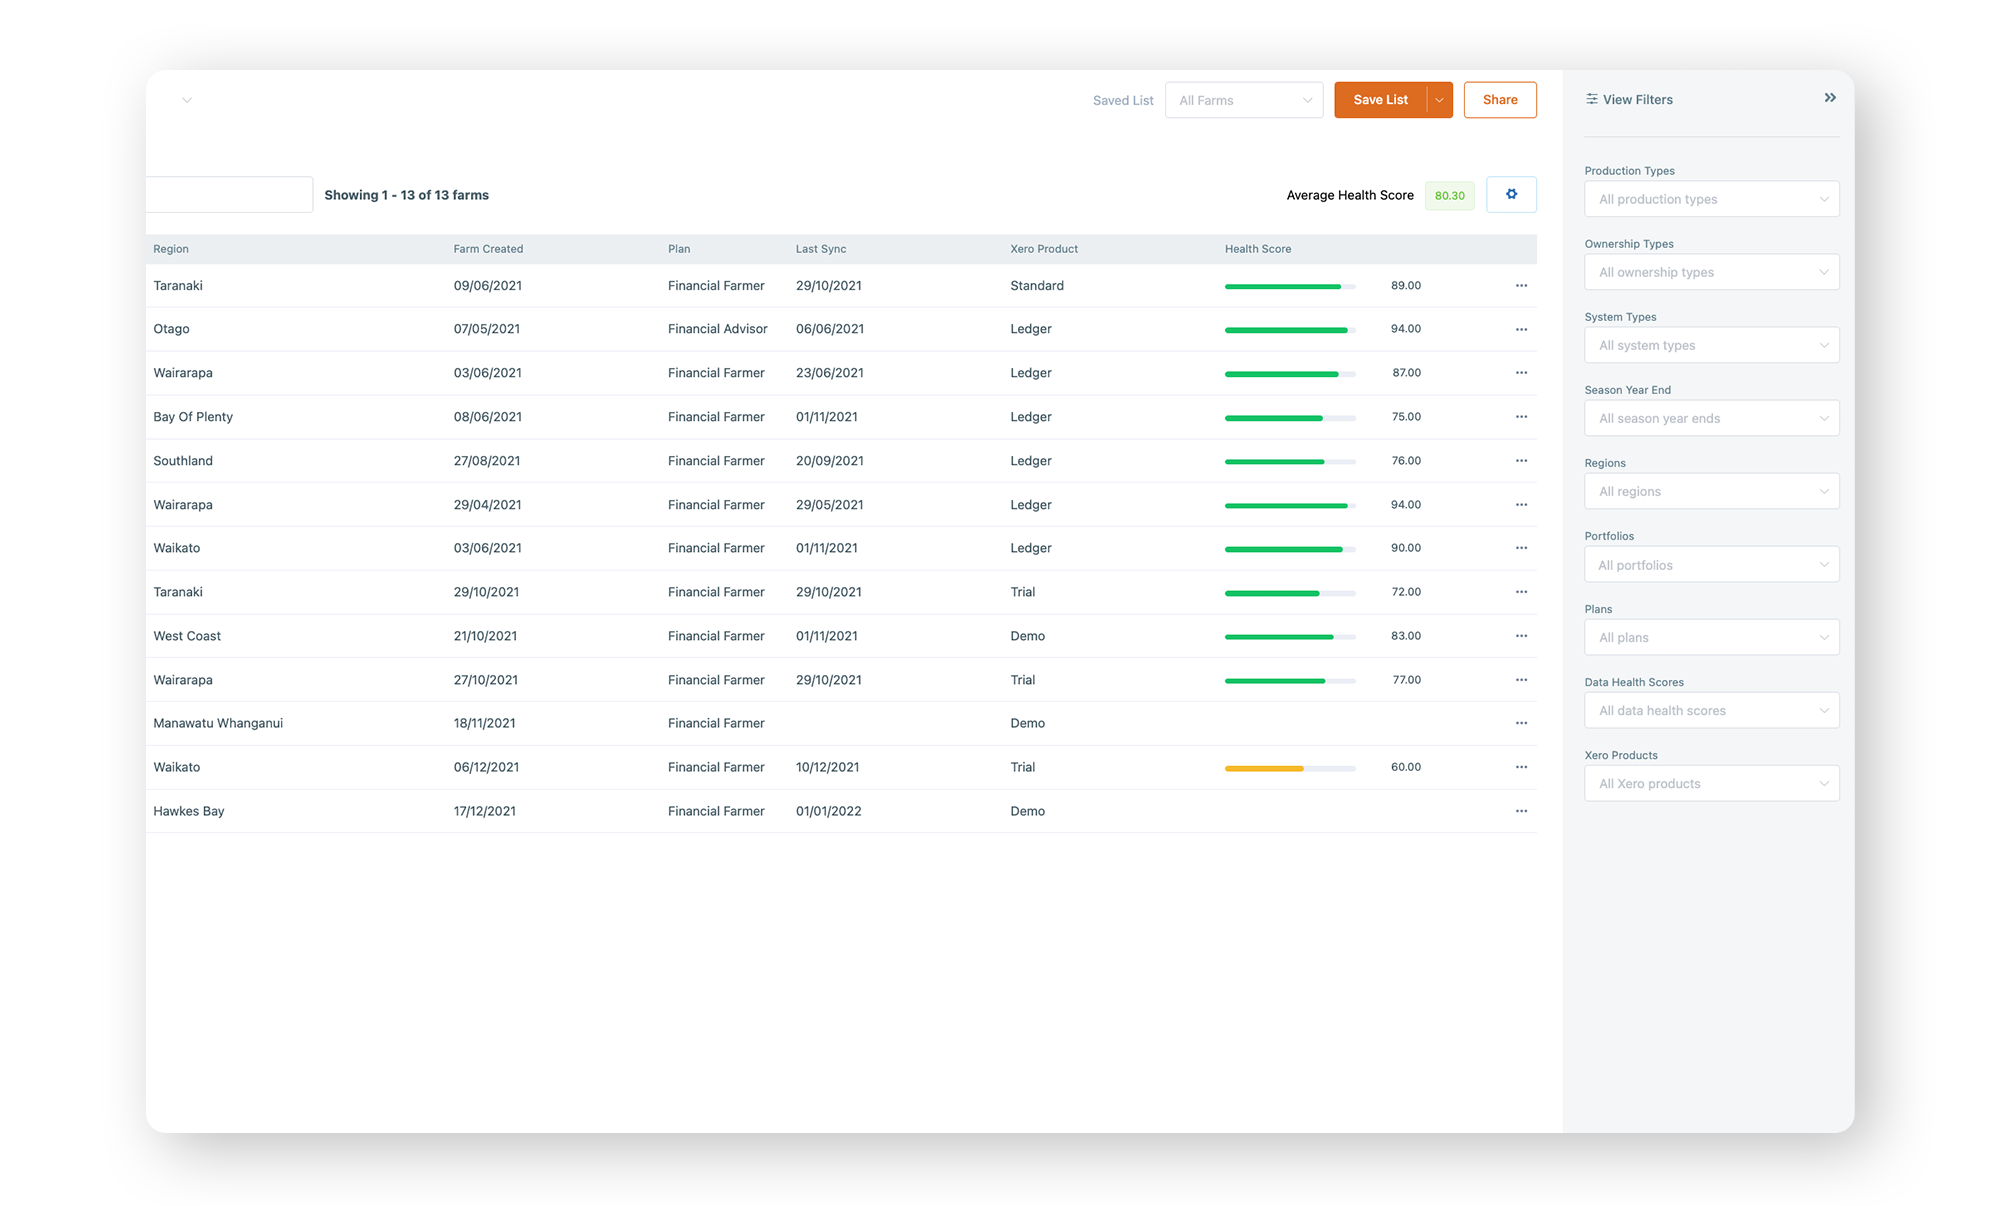
Create custom portfolios by segmenting clients by a range of options including farming type, region, farms assigned to an advisor or who clients bank with.
Use this to quickly enable deeper, more intricate analysis of key subsets of clients.

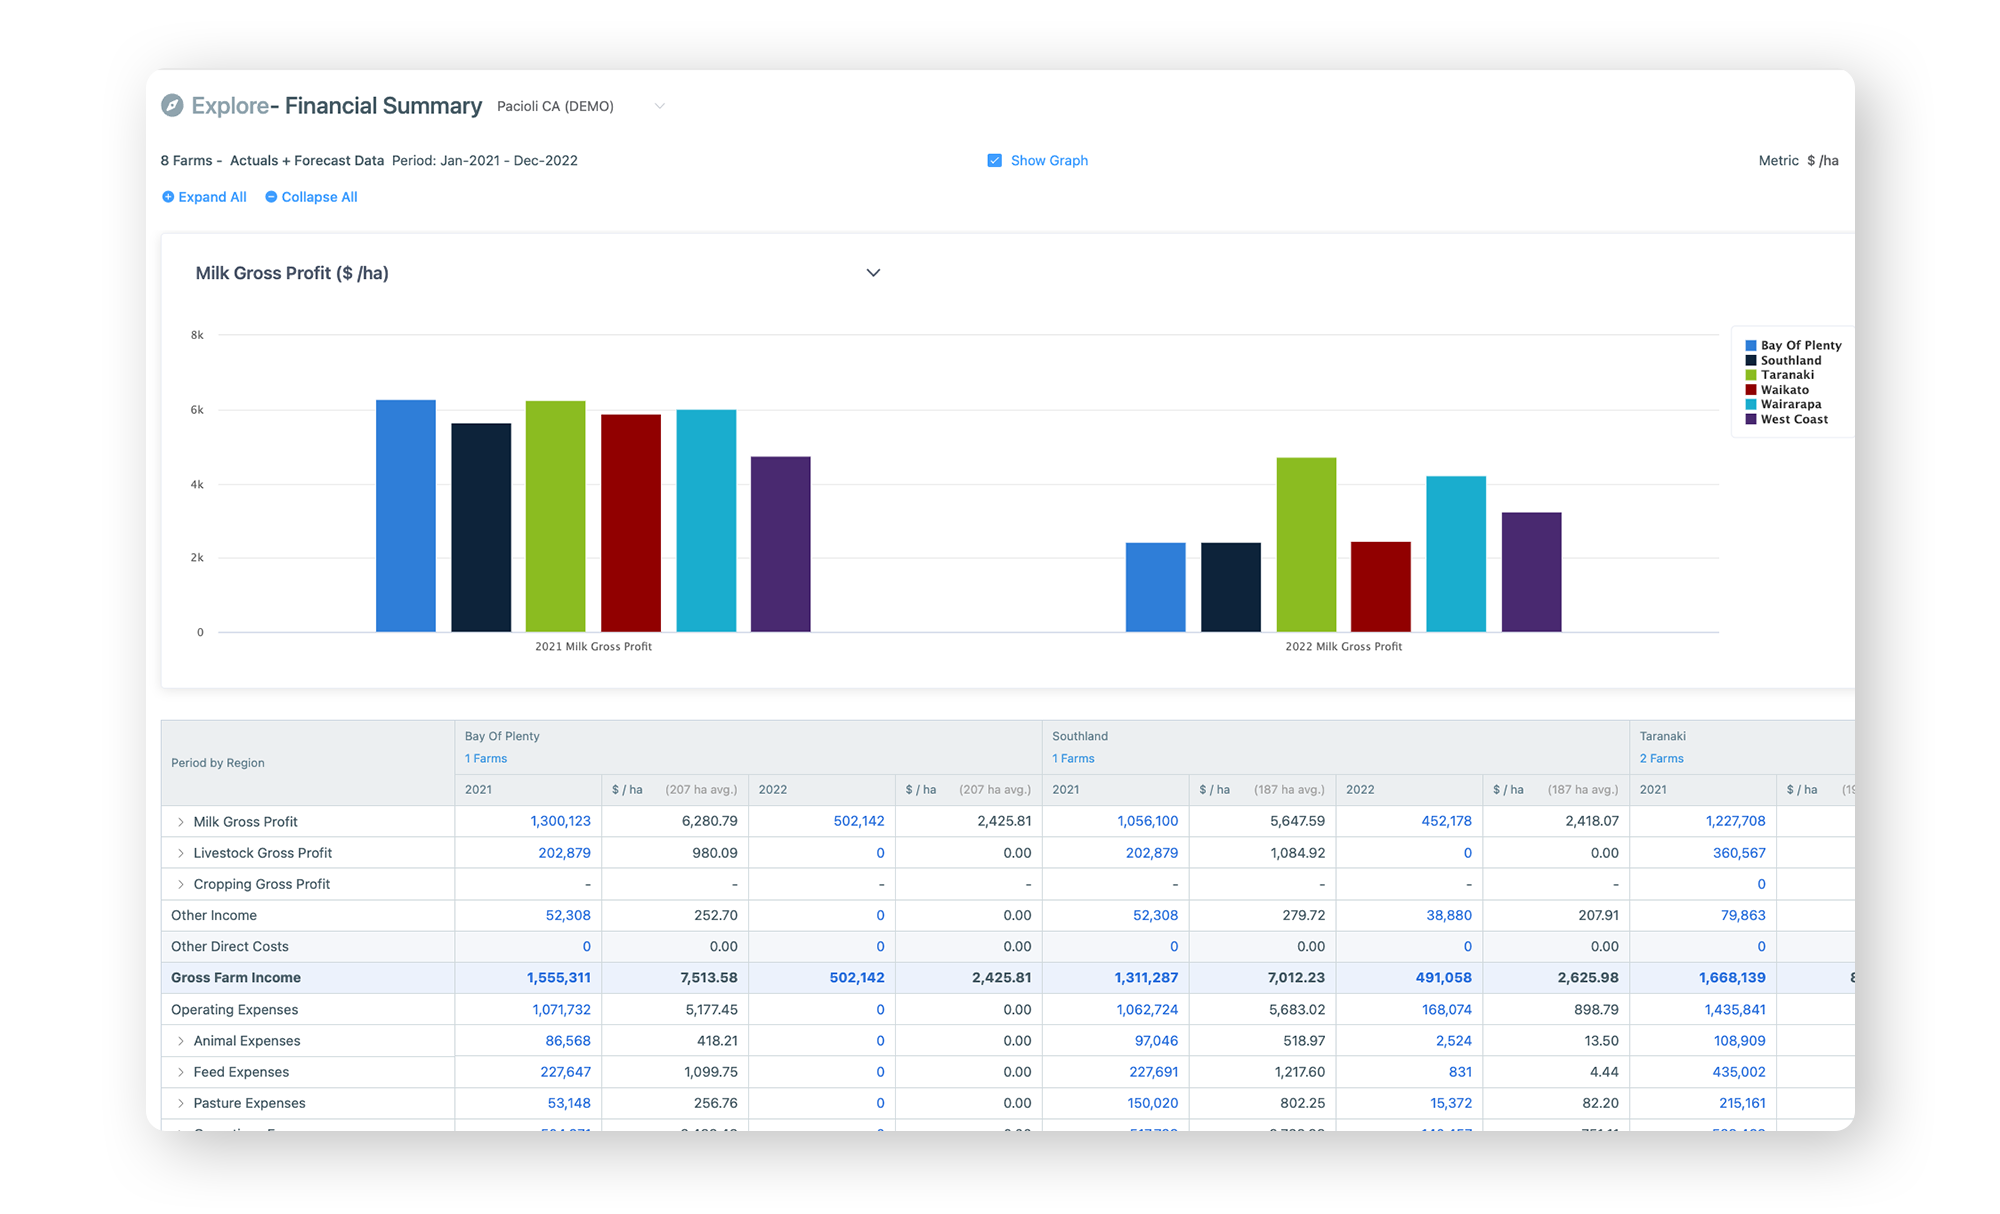
Clearly view your clients top line production and financial metrics, analyse performance trends across key ratios and KPIs in just a few clicks, and show your clients how they compare to their peers by region, production type, or by a custom portfolio.
Use these tools to uncover opportunities or track farms at risk and present trend analysis at an aggregate or individual level as part of your value add advisory services.

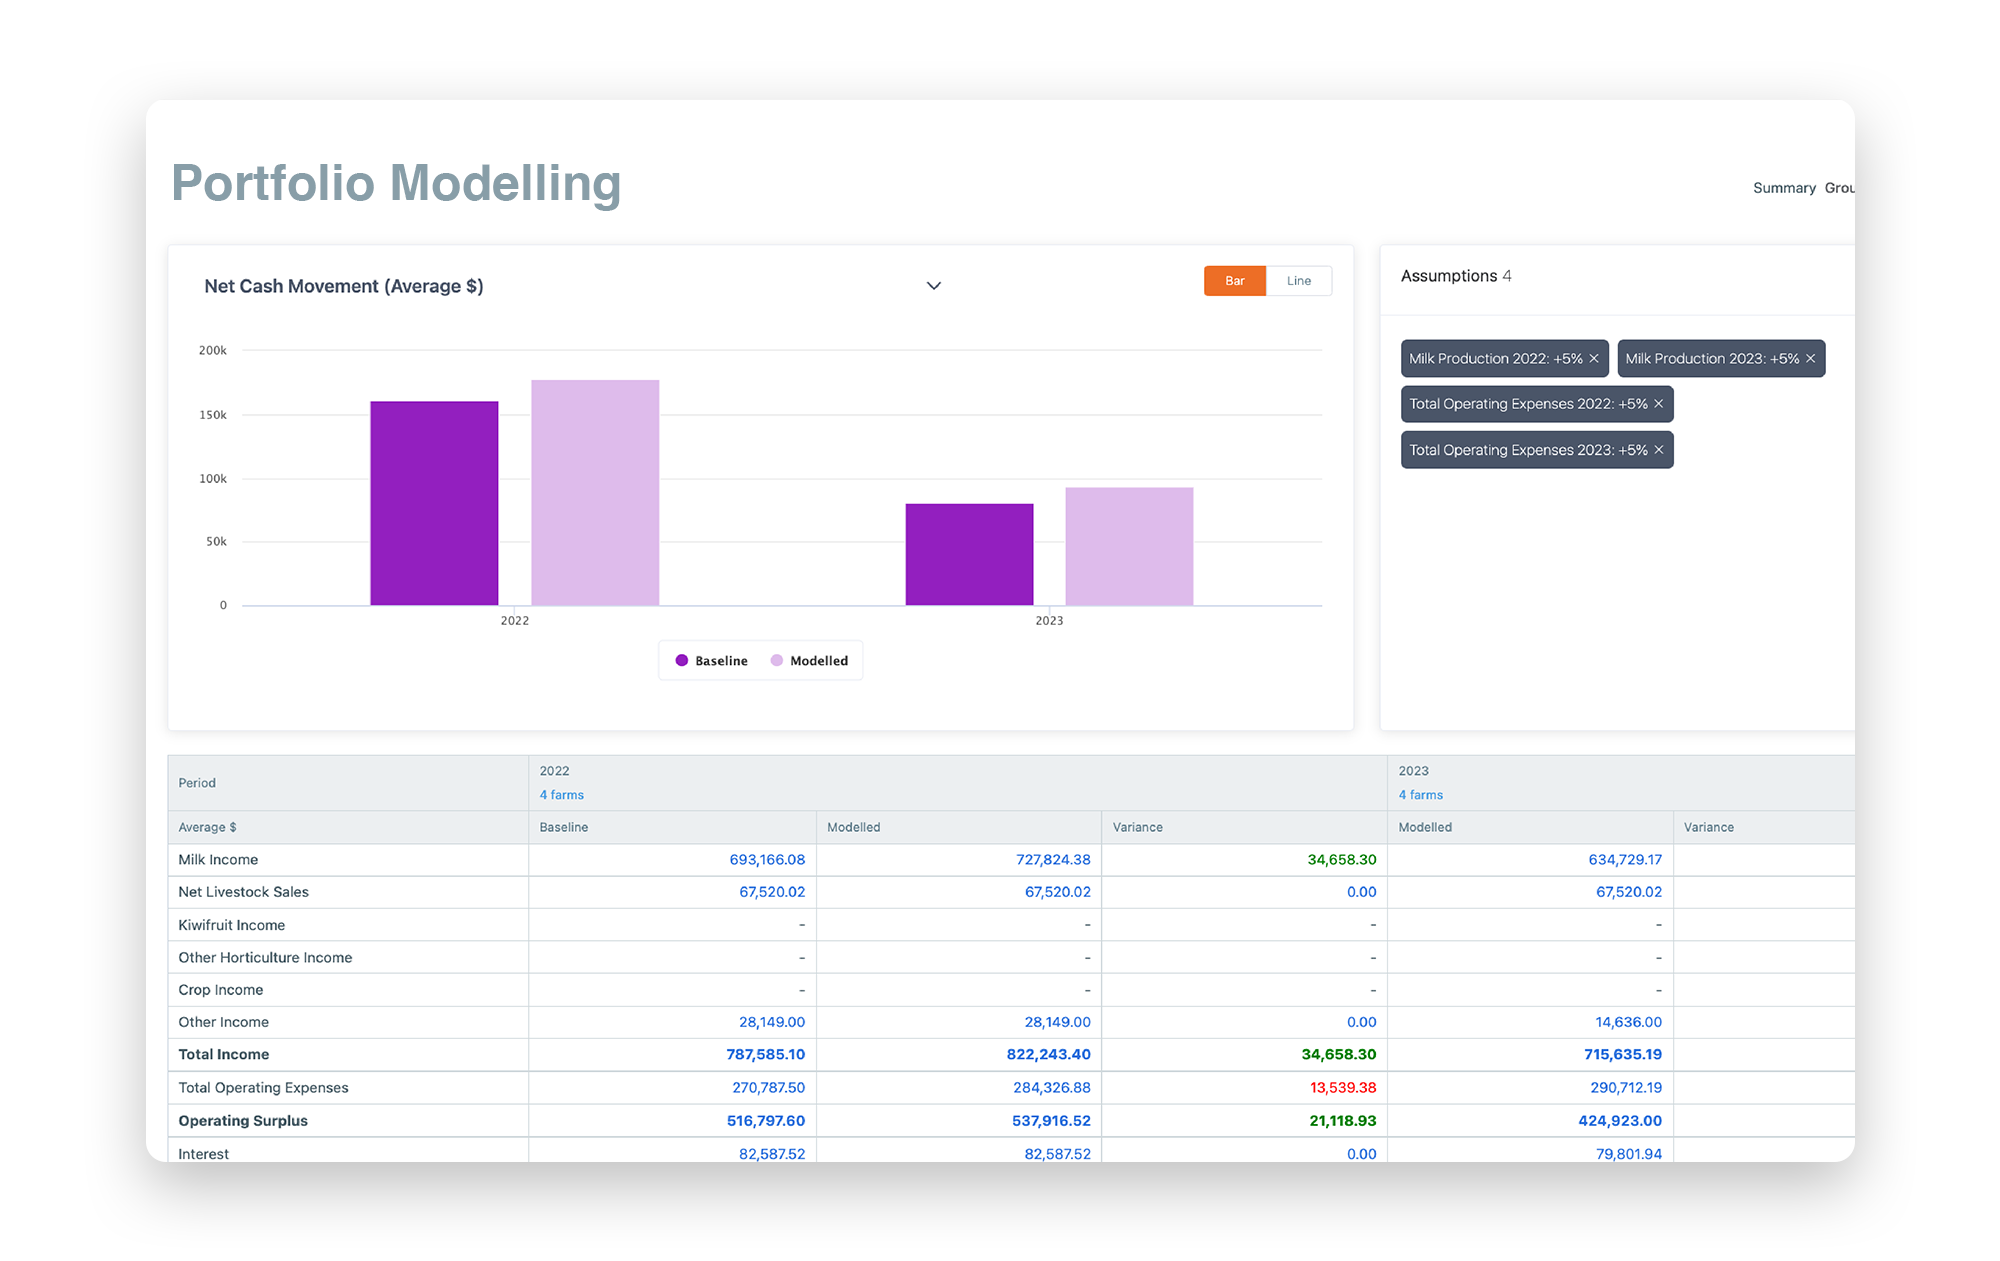
Portfolio modelling is a ‘what if?’ tool that allows you to easily model out various future focused changes across farms to stress test against different scenarios and understand risks.
Use this to front foot future events with your clients such as changes to commodity prices, increase in costs or the impact of environmental events. Easily see the impact on financial metrics and KPIs across a portfolio or at an individual farm level. Use this to accelerate the growth of your advisory services and support clients when they need it most.

With Figured Insights, all your data is instantly accessible in one place, so you don't need a data or IT specialist to get started.
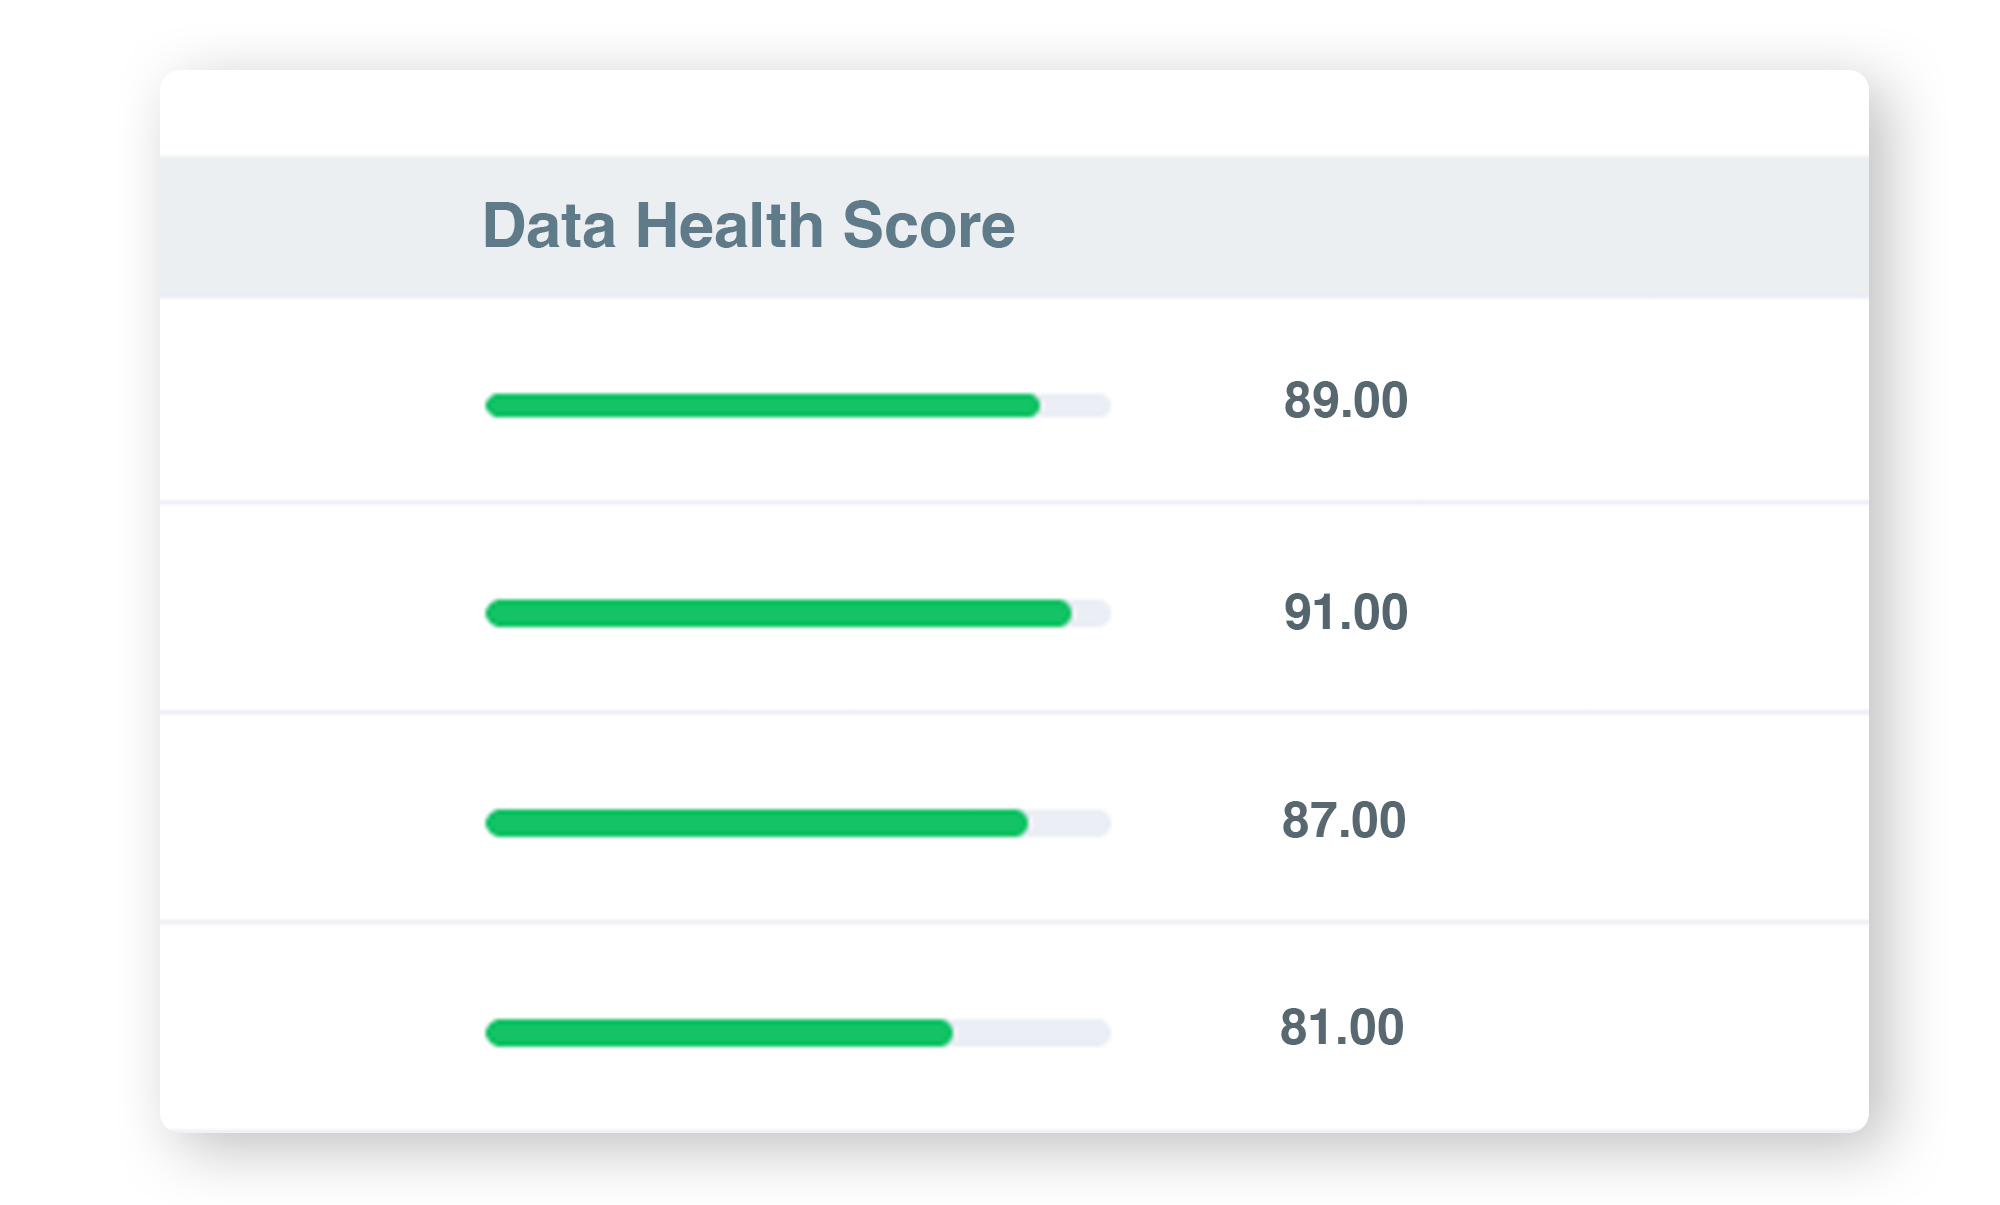
Figured Insights automatically syncs data from the Figured webapp, meaning from day one you always have a standardised and up-to-date data set to work with. Data health scores are also calculated for each farm so you can continually assess data quality and be confident in your analysis.
