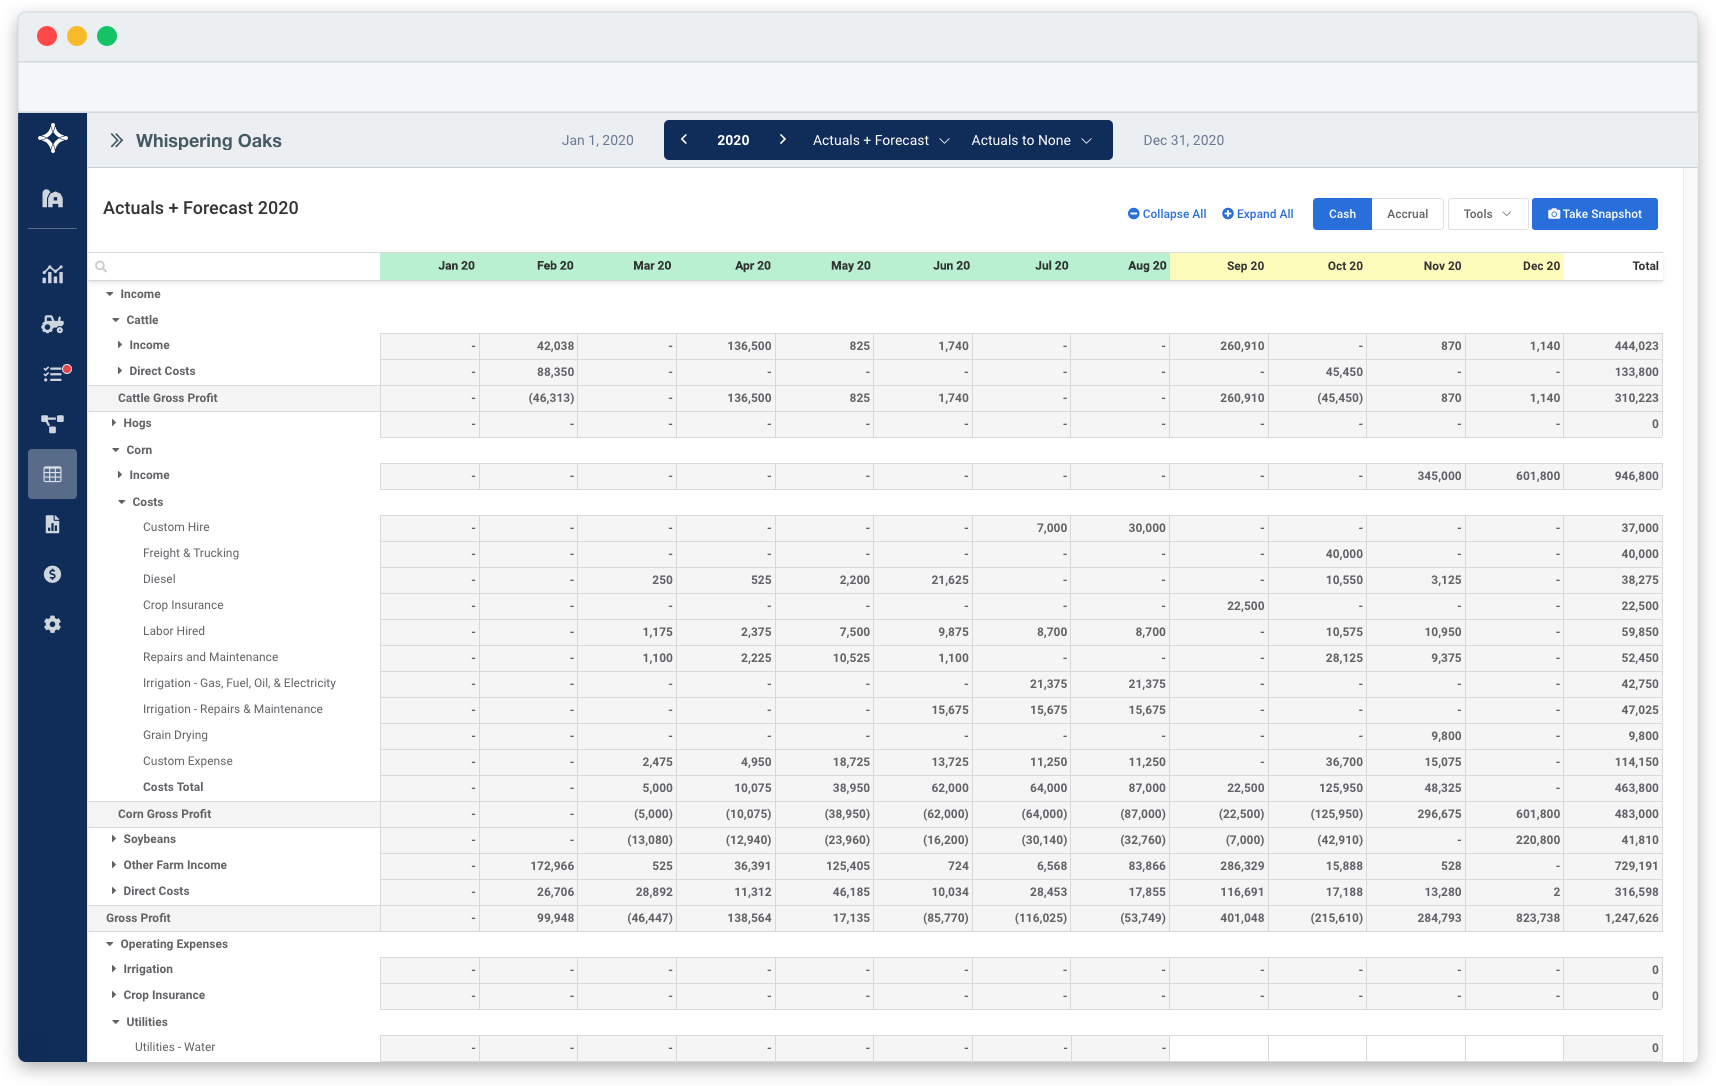


The Figured planning grid is designed to be as user friendly as the spreadsheets you’re used to, but connected to both your accounting software and to your farm production data. This means you can build a financial plan to the level of detail that suits you, and keep it up to date in real time.

We know that not everyone runs their farm to a 12 month calendar, so Figured does away with season overflows and fixed 12 month budgets. Using Figured, you can get started on financial planning from any point in time, without spending time building the initial budget or opening position at the start of each budget year.

For farming teams who want to test different long term scenarios on the farm, we’ve built the Figured scenarios tool. Create multi-year plans which model anything from farm expansion, weather events and commodity fluctuations, to something as simple as machinery purchases. This tool allows you to measure the impact of major financial decisions before you make them.
Conditions can change frequently in a farming year, so financial plans need to be adaptable to account for these changes. Figured enables you to update your financial plan at any time with reforecasting of incomes and expenses. The app also stores every version of your plan so you can review your progress throughout the year and keep your team informed of changes on the farm.

Farm production plans are based on quantities such as stock units, harvest tonnes, kgMS, metres of fencing or litres of water, usually making it difficult to forecast and track associated income and expenses. Figured takes the farm operation activities and maps these to related costs, so your production plan is backed by a robust financial plan.