
Product Update: NSC Valuation
We’re constantly working on our product to give you the simplest and fastest experience at tax compliance, so that you can focus on the more important stuff such as advisory.

Bringing you a whole new world of cropping
We’re delighted to introduce to you the most powerful solution for managing and tracking production and sales activities for crop farmers.

Product Update: An easier way for you to add value to your farming clients
We’re delighted to introduce to you our newest feature: Snapshots and the Rolling Plan.
You now have the simplest way to build, manage and update your financial plan, while keeping a record of all the changes you’ve made as you’ve moved through the year.

Product Update: NSC Valuation Improvements
Our amazing Kiwi partners - you asked, we listened.You can now value your client’s livestock using the National Standard Cost (NSC) method from within the Figured app, more accurately.
What we’ve done
We’ve improved our NSC valuation calculations in the following ways:
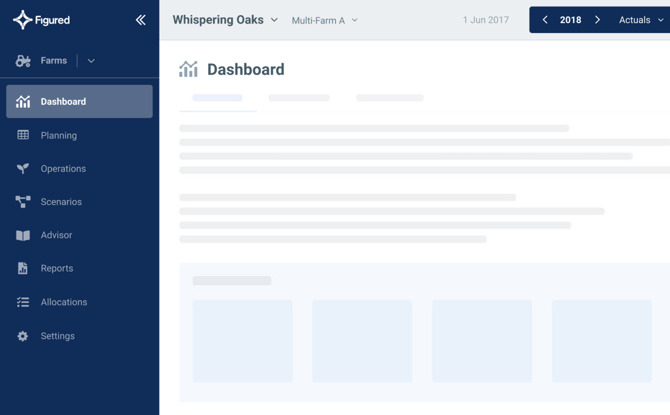
New look, fresh feel, same Figured
Over the coming months, you’ll see a range of improvements in Figured which will makeplanning and managing farm budgetssimpler and more powerful, to kick things off we are launching an improved navigation and user interface.

Benchmarking - Point of interest vs value
The ability to benchmark the physical and financial performance of a farm is nothing new. It has been available to farmers for many years now and delivered from a number of sources and in a number of formats.
Product update: Cropping enhancements
Our latest product release has a number of new features and enhancements available for our cropping and mixed farms on Figured.
Forecast balance sheet (beta)
This feature allows budget movements in assets, liability and equity, and when combined with real-time actuals from Xero, enables a true three-way forecast position.
Import / Export tool
This updated layout is more intuitive for import and export actions. With the ability to import the file from one year to the next, without having to change the date, it makes exporting your actuals to the next years budget so much simpler.