Your clients' financial data is already inside your accounting software β every transaction, every category, every production period. The problem isn't the data. It's what happens to it next.
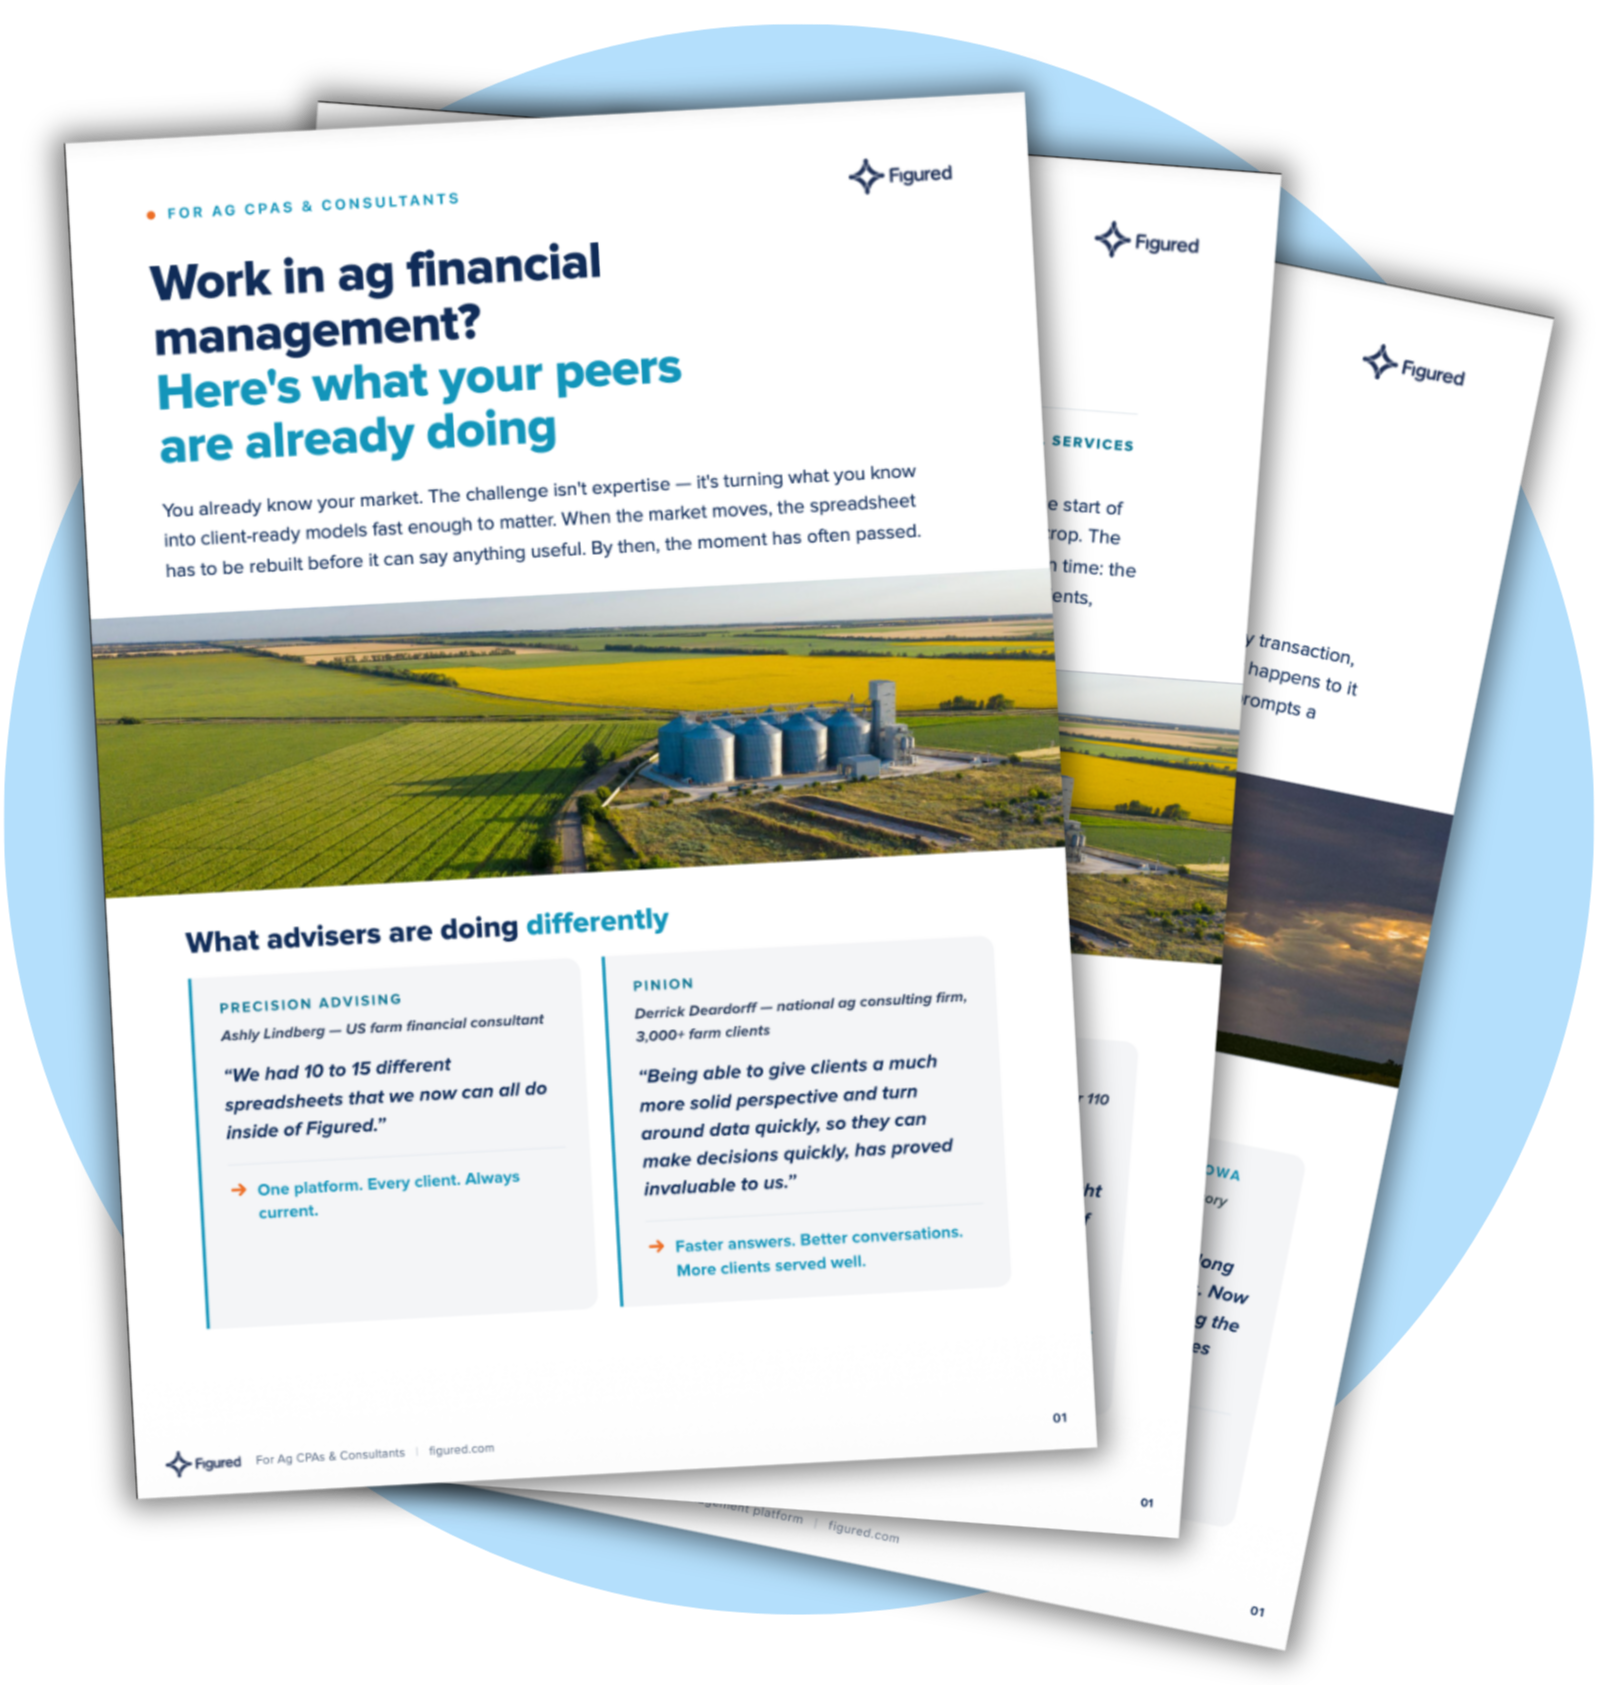
An annual report that looks the same as last year, gets filed, and never prompts a phone call.
Most tools don't understand enterprises. They don't speak in dollars per acre, cost per head, or gross margin by crop. They produce static PDFs that go stale the moment they're exported β generic outputs that don't reflect the farm's real position.
What Changes with Figured
P&L, cash flow, balance sheet and gross margin by enterprise β pulled directly from Figured and updated as actuals flow in.
Build your best report once at the org level, then open it across every farm in your portfolio: same structure, live data, ready to send.
Change the reporting period once and every component updates instantly. What used to take hours takes minutes.
Purpose-built for ag advisory: drag-and-drop components, gross margin by enterprise, and AI commentary that writes the narrative for every farm.
What's Wrong Today
Figured connects directly to QuickBooks Online or Xero and produces farm-native reporting from the data already in your workflow β no exports, no reformatting, no rebuilding from scratch every time conditions shift.

I spent 50 minutes of an hour-long meeting defending the numbers. Now we spend five minutes confirming the numbers are right, and 55 minutes on strategy.