Introducing

Reporting StudioPurpose-Built Agri Reporting Your Farming Clients Will Actually Understand

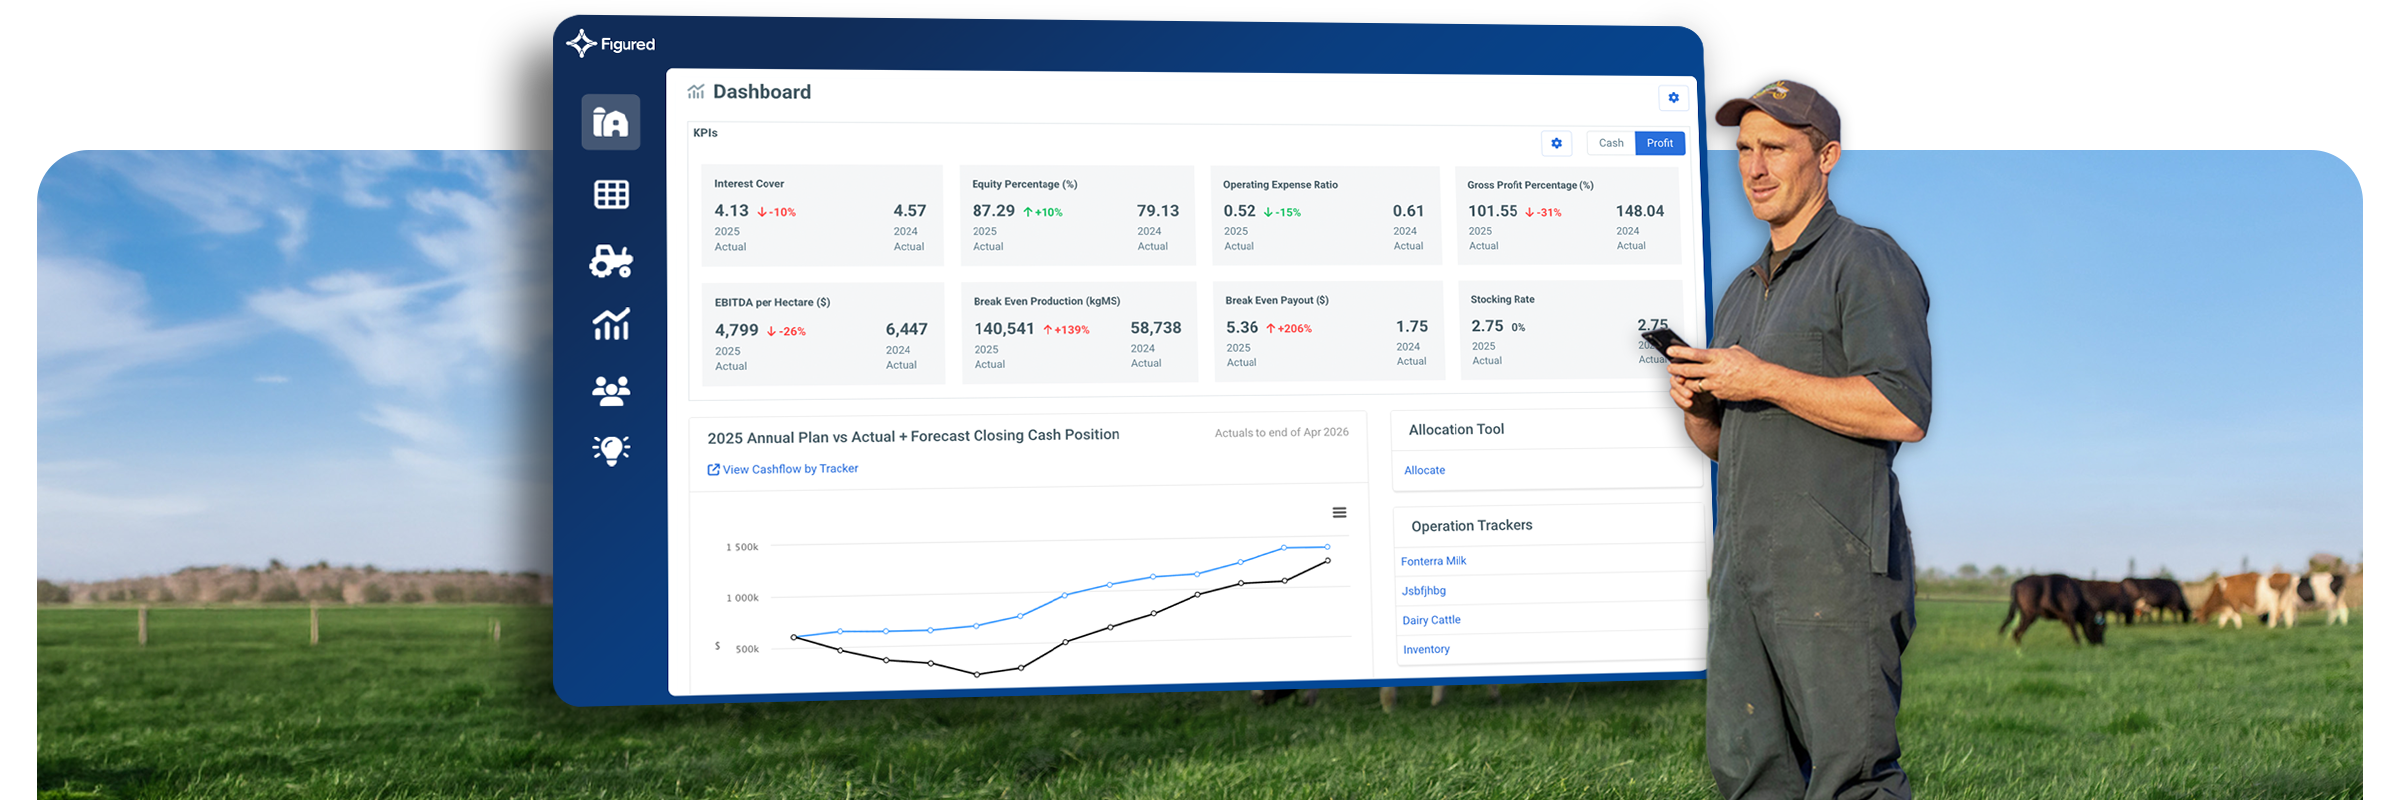
Professional, visual, branded reports built on the live numbers already in Figured. More efficient to produce, tailored to every farm, and powerful enough to start the conversations that matter.
header-product-reporting-studio

Why Reporting Studio

Better Reporting, Without the Extra Hours

Five ways Reporting Studio changes farm reporting for your practice and your clients.

Time Back in Your Practice

One template. Every farm. No reformatting, no rebuilding, no starting from scratch

Reports Clients Understand

Clear, visual, and easily interpreted insights with AI commentary

Your Metrics, Your Way

KPI tiles, charts and flexible columns. Build exactly what that farm and that conversation needs.

Your Brand, Every Report

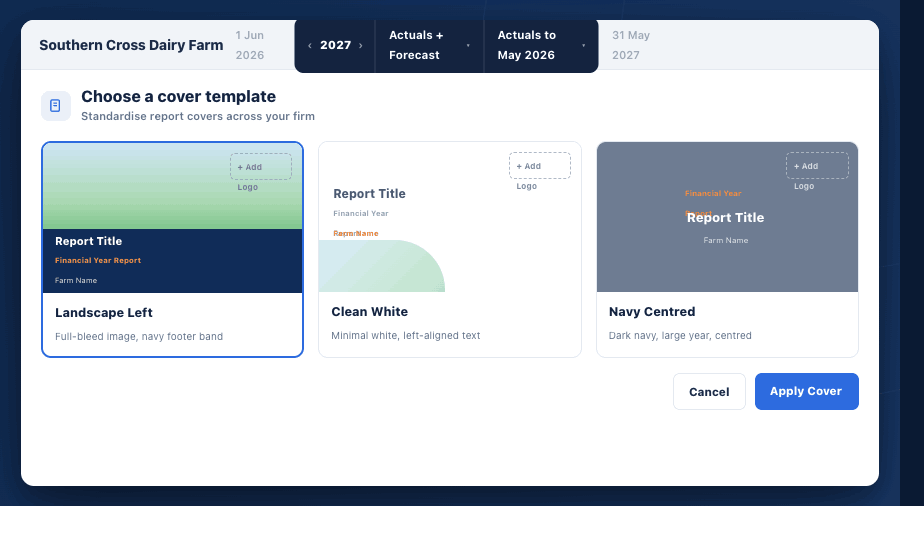
Your logo, your colours, your cover page. Every report looks like it came from your firm.

More Clients, Same Capacity

Compliance, advisory or somewhere in between, Reporting Studio scales with your practice.

A Closer Look

Built for the Way Your Firm Reports

For all farm types β€” cropping, livestock, dairy and mixed farming.

01-Formula-Builder

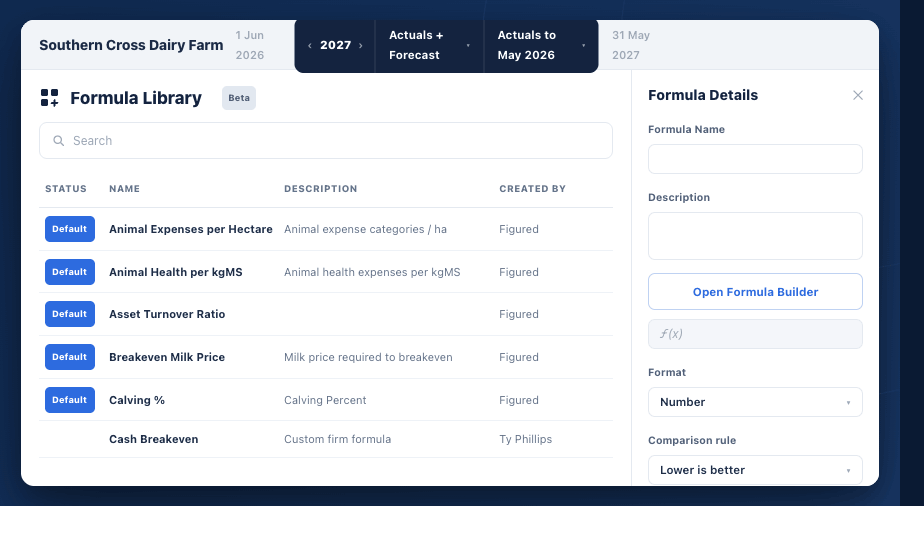
Formula Builder

Build, standardise, and share KPIs across your firm.

  • See exactly how default Figured formulas are calculated.
  • Build your own metrics using live farm data from Figured.
  • Create firm-level KPIs to ensure consistency across your practice.
02-Custom-Reports

Custom Reports

Generate tailored, engaging outputs that bring insights to life.

  • Start from a template or create your own report from scratch.
  • Customise layout and add charts, commentary, images, and branding.
  • Combine multiple production and financial reports in one view.
  • Instantly pull in your formulas, KPIs, and live data.
03-Org-Level-Templates

Org-Level Templates

Standardise custom reports to ensure quality and efficiency at scale.

  • Turn custom reports into reusable templates for your firm.
  • Maintain consistent structure and quality across all outputs.
  • Roll out quarterly reviews, bank packs, or management summaries in minutes.
04-Auto-Analyst

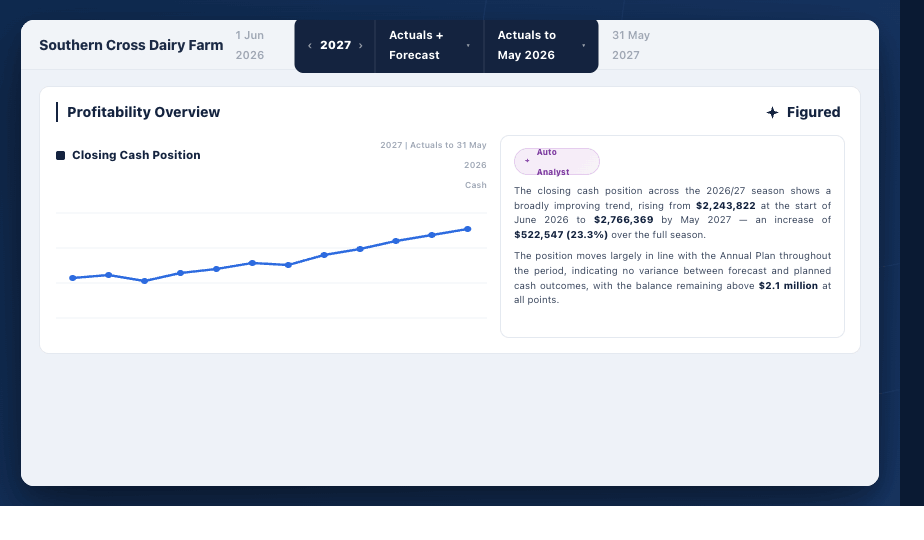
Auto Analyst

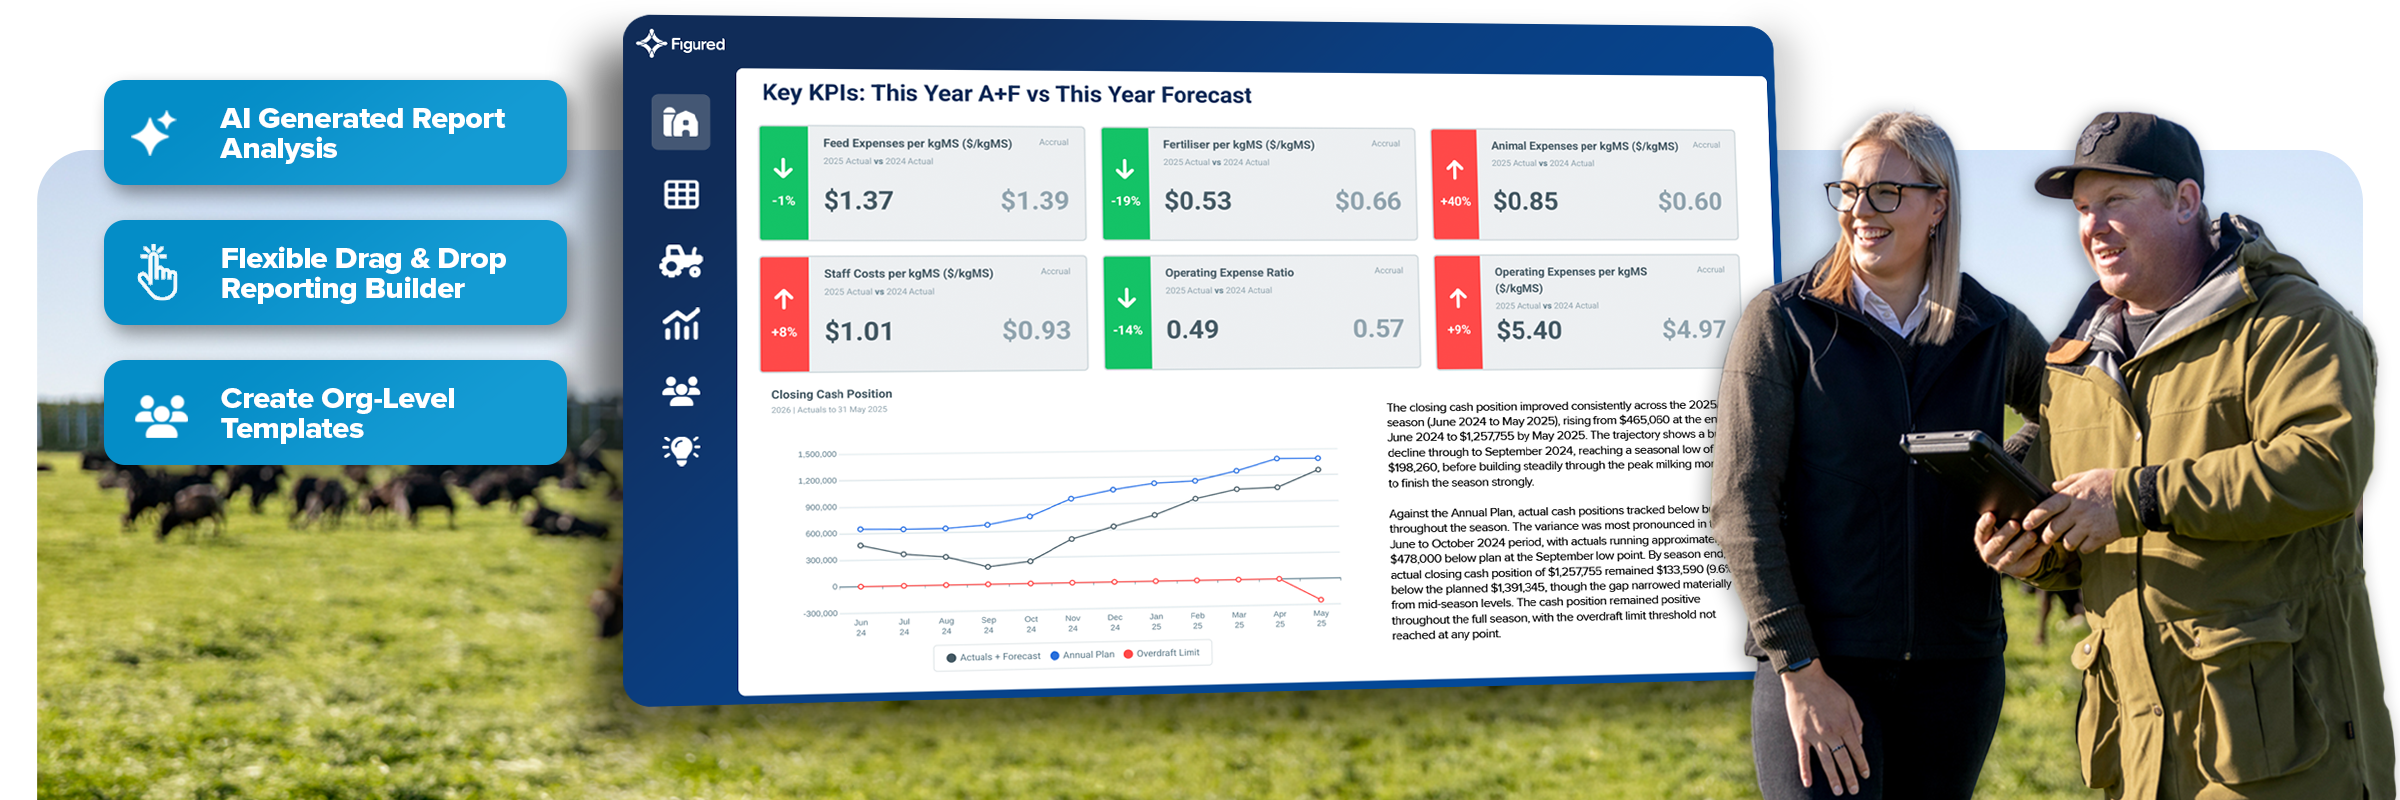
AI commentary that writes itself.

  • Reads the numbers on the page and writes the narrative for you.
  • Configured once at org level. Personalised for every farm, every report.
  • Choose your format β€” executive summary, detailed analysis, or bullet points.
  • Edit any time, or let it run.
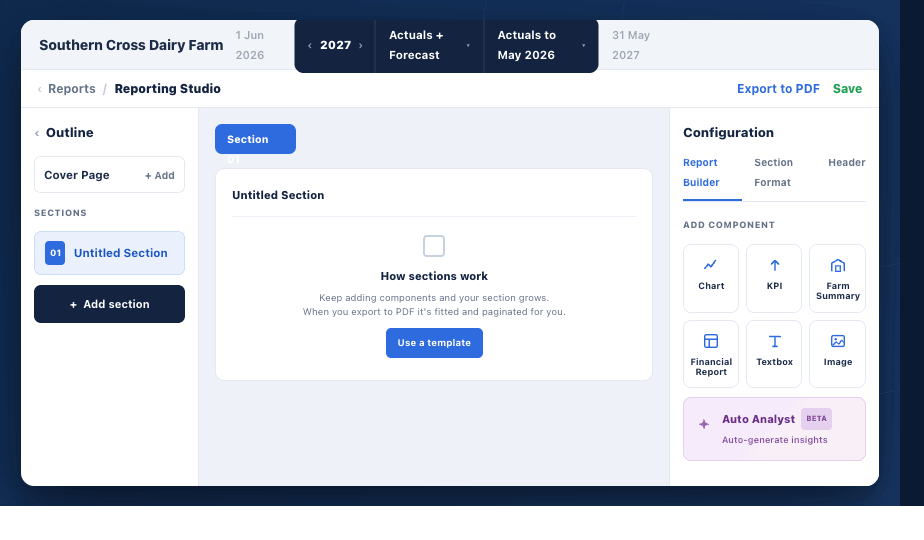
05-Drag-and-Drop-Builder

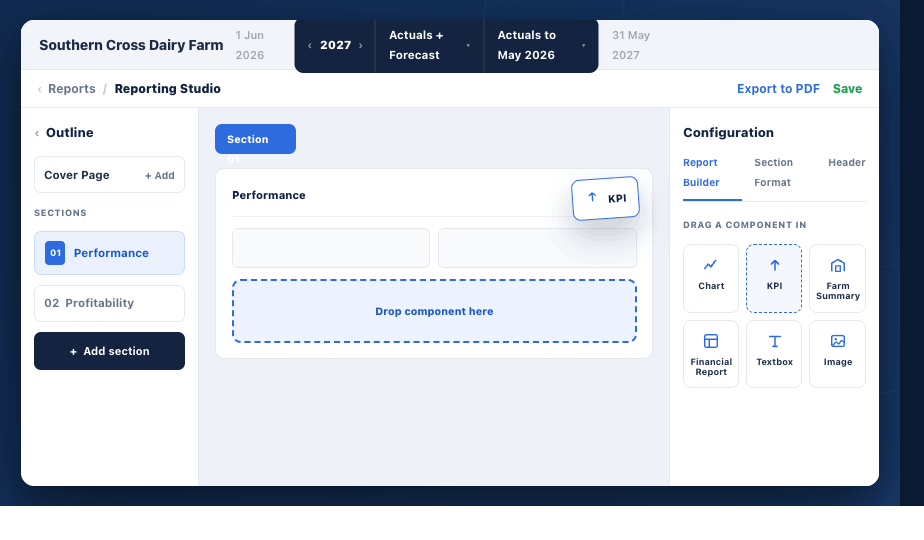
Drag and Drop Builder

Six components. One canvas. Build exactly what your client needs.

  • Chart β€” bar, line, stacked, comparison.
  • KPI β€” headline numbers, delta, comparison.
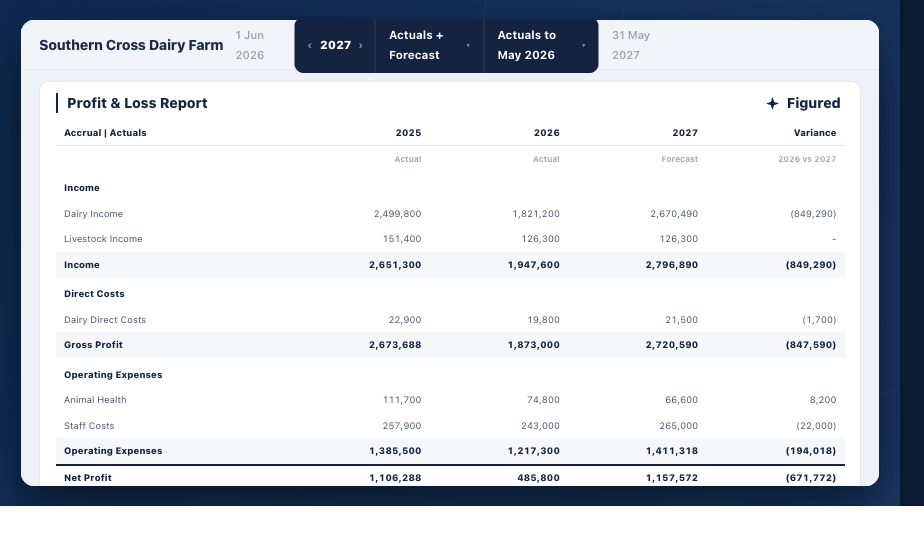
  • Financial Report β€” P&L, Balance Sheet, Cash Flow.
  • Farm Summary β€” the farm’s own facts, anchored.
  • Textbox β€” notes, context, narrative.
  • Image β€” farm photo, logo, brand mark.
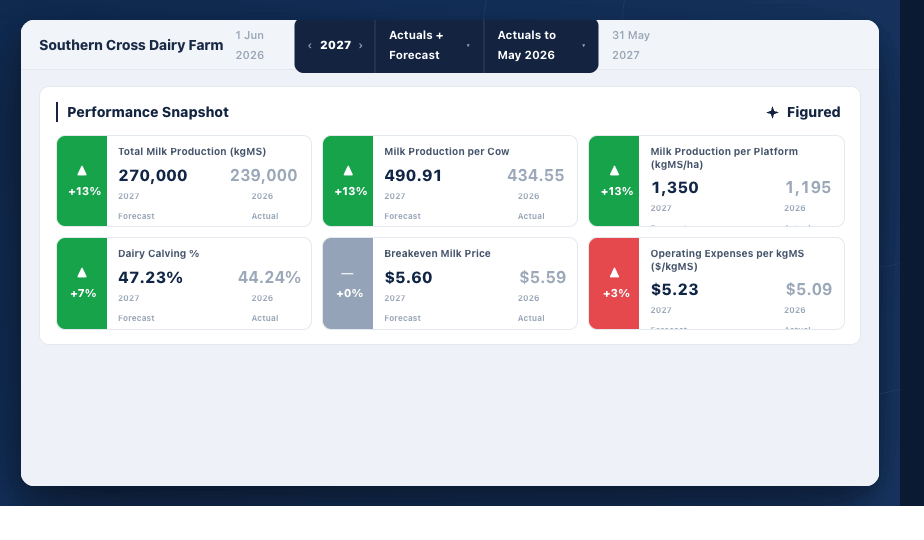
06-KPI-Tiles

KPI Tiles

The numbers that matter most to that farm and that conversation.

  • Choose from Figured’s default library or build your own using the Formula Builder.
  • Gross margin per hectare, operating surplus per kgMS, cost of production per tonne.
  • Place them anywhere in the report.
  • Set once at org level and they populate automatically for every farm.
07-Flexible-Columns

Flexible Columns

Build the column structure that fits the conversation.

  • Add variance, production ratios, historical averages, and custom date ranges.
  • Rename columns to suit each client β€” β€œSeason to date”, β€œBudget”.
  • Drag rows and columns into any order.
  • Build it once at org level and it applies across every client.

See Reporting Studio in Action

Five minutes. Blank canvas to finished report.

Download Free

See the Reports Your Clients Could Receive

This report walks through every feature in detail. Enter your details and we will send it straight to you.

Send Me the Report
US Reporting Studio Guide Thumbnail-1

Built with Agri Accounting Experts

Nearly 3,000 farms already have access to Reporting Studio through beta. 50+ features built from the ground up with agri accounting and advisory firms across Australia and New Zealand.

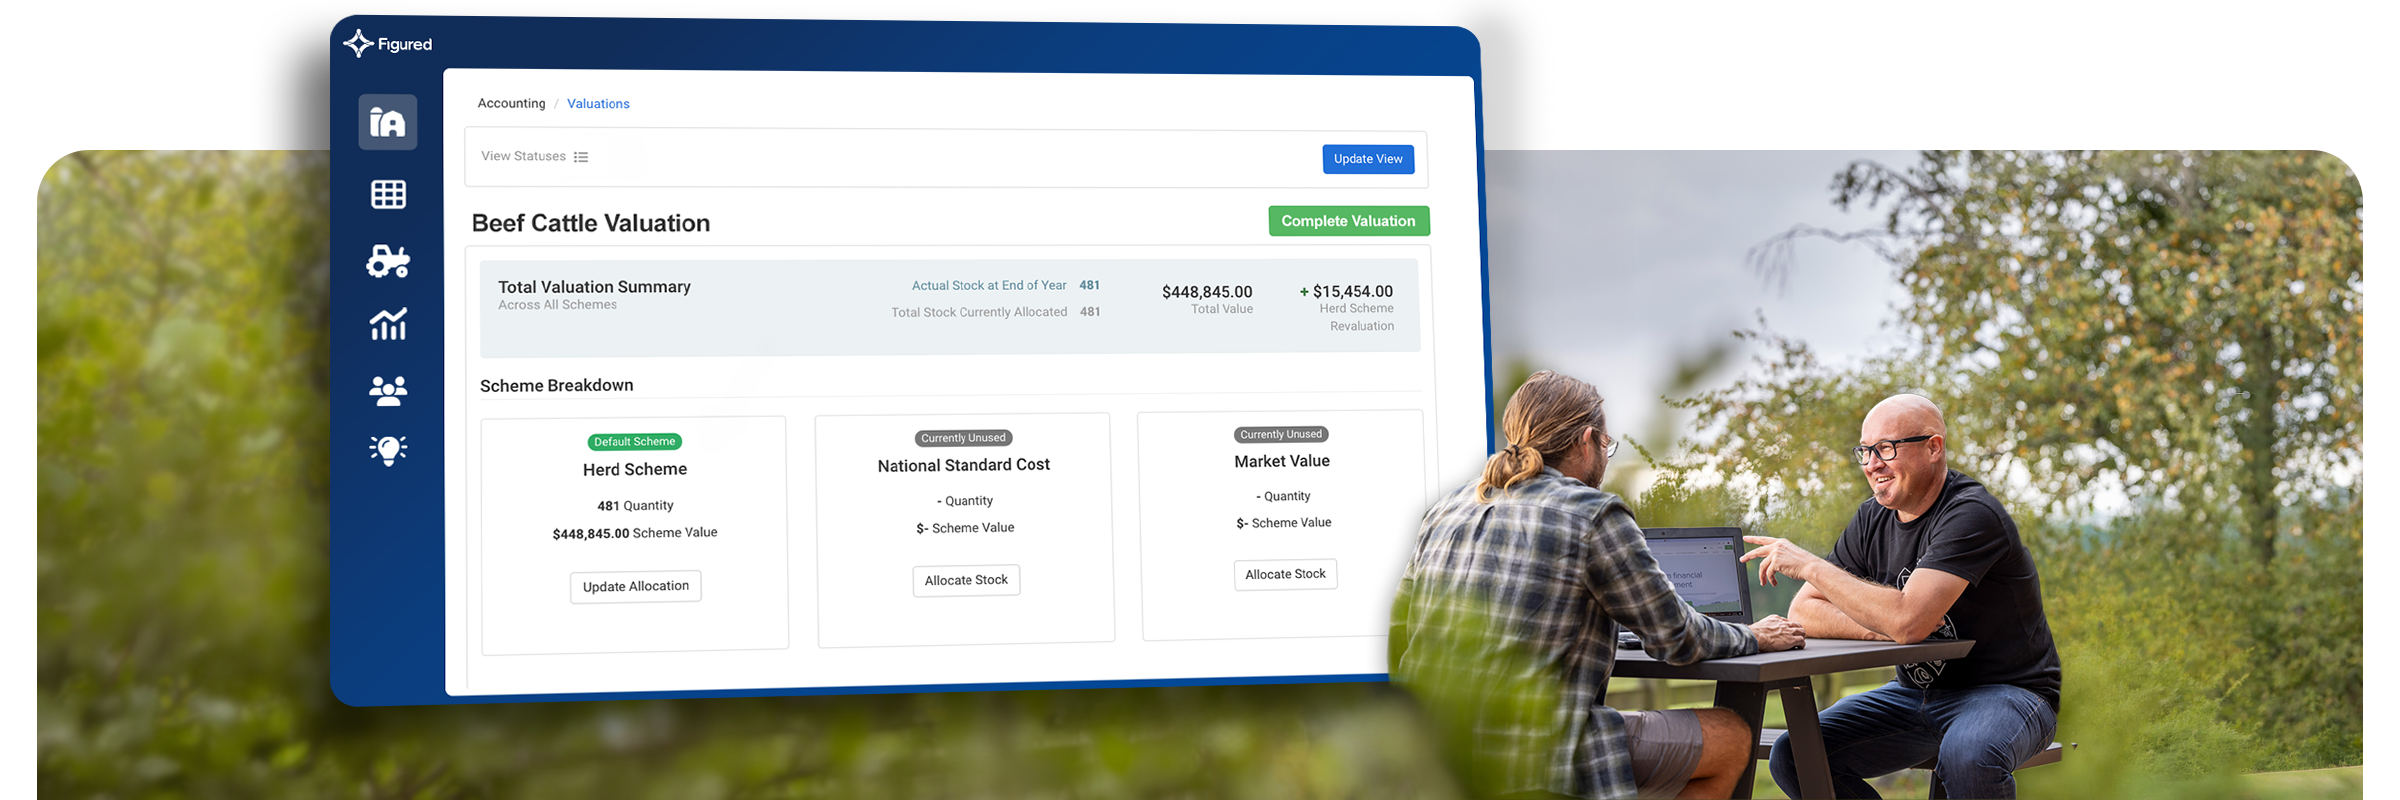
A farmer and his adviser working through farm numbers on a laptop at an outdoor table

Your Competitive Edge

For Advisers

Deliver insight-driven reports tailored for any purpose or client β€” whether it’s for an end-of-year client meeting, a bank presentation, or a quarterly review.

For Farmers

Get clear, engaging reports that link real-time financial performance to what’s happening on your farm, helping you to make business decisions with confidence.

Don’t Just Take Our Word for It

Hear what early adopters have to say.

A lot of our clients can get quite overwhelmed by pages and pages of numbers in a format that traditionally suits us rather than them. So the biggest opportunity is that the new functionality will make it much easier for us to get that across the line.

The Formula Builder is a game changer. If we can put stuff in a visual framework, we’re seeming to get a lot of traction with clients, whereas if it’s a page of numbers, people struggle with that.

With this new reporting, we’ll be able to produce professional, easy-to-read reports that make a huge difference in how we communicate with our clients. On top of that, the Formula Library enables us to speak to farmers in a language they understandβ€”or that their bank is familiar with.

Reporting Your Clients Will Actually Read

Reporting Studio is built on the live numbers already in Figured β€” no rebuilding, no reformatting. Watch the five-minute demo, or talk to us about rolling it out across your firm.