For Agri Accountants
With current-season data arriving over 12 months ahead of any other NZ source, Figured Benchmarking is how you show your top 10% dairy clients they’re best-in-class — and help the rest get there next.
The World’s Largest Farm Financial Management Platform
There’s a reason thousands of agri-accounting firms across New Zealand, Australia, the UK, and the USA run their farming clients through Figured. More than 35,000 farms trust the platform — and the advisers who use it every day know exactly why.
“There’s only so much you can do with last season’s benchmarks.”
Most farming industry reports arrive months after the season they describe. By the time the data is ready, the decisions it could have shaped have already come and gone. The benchmarks might confirm what happened, but they spark a conversation that only looks backwards.
To get ahead of this problem, a growing number of NZ dairy advisers are doing it differently.
They’re using a benchmarking platform that draws from current-season data which becomes available a year or more ahead of any other local source. By looking across their full portfolio, they’re able to start useful advisory conversations while the next season is still being planned.
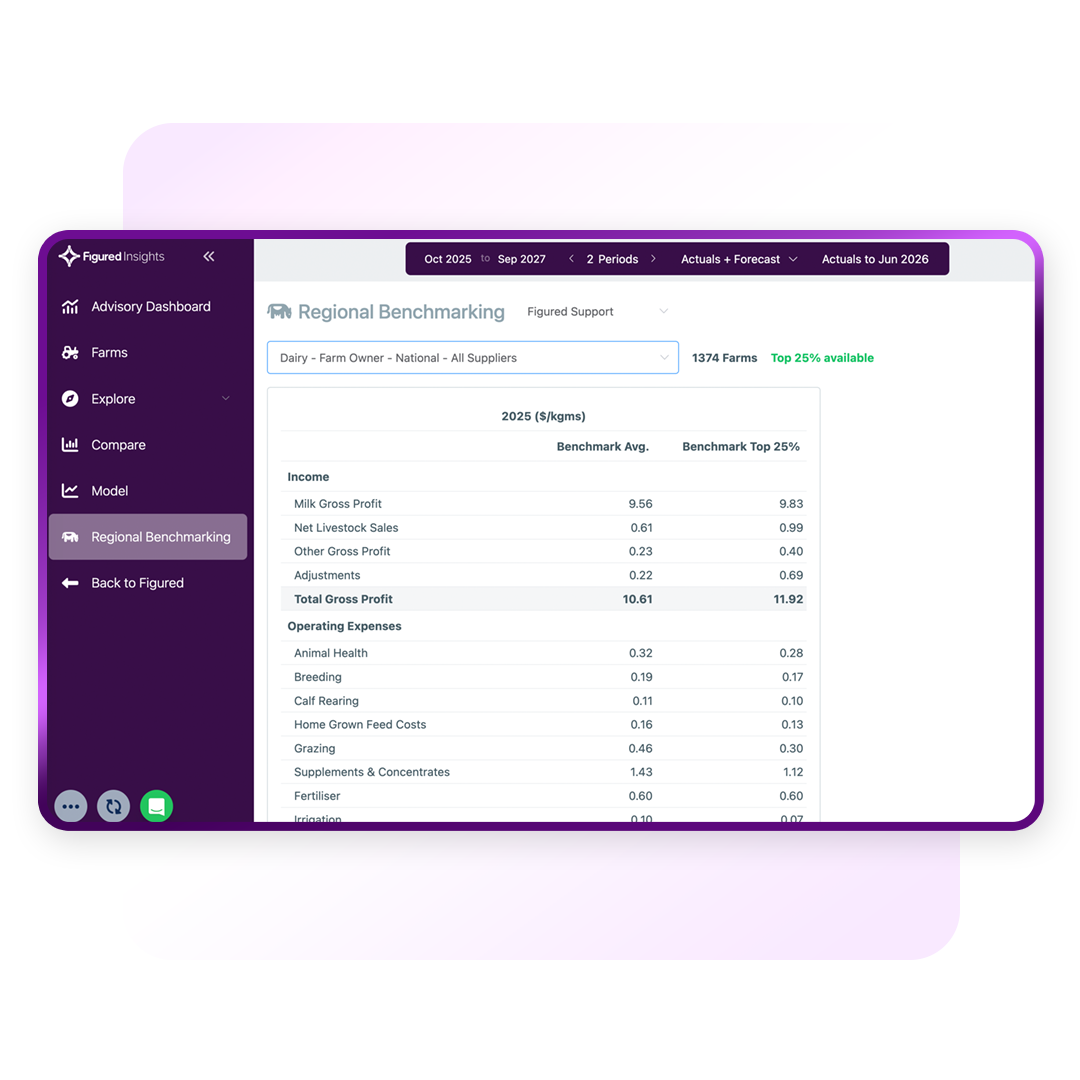
National and Regional Benchmarks
Figured’s national dairy benchmarks are built on verified actuals from 2,000+ carefully selected NZ dairy farms, filtered by region, supplier, and ownership type.
Benchmarks cover all five NZ dairy ownership types across P&L income and expense categories, on an accrual or cash basis — plus national averages and top-quartile comparisons.

Reporting Studio
The Figured Benchmark Report can also be included in Reporting Studio, Figured’s powerful custom report building tool.
Enhance your advisory conversations by dropping client benchmark findings into your report templates once at the organisation level, then open across all of your clients with the data populating itself. Auto Analyst writes the commentary for you, adding further explanation and trends analysis without the extra manual effort.

Data Quality
Every benchmark in Figured’s national report is built to a strict standard, with a minimum 50 farms per group, outliers removed using statistical methods, standardised expense categories across every farm, and a published methodology in the report appendix.
Plus, data quality scores for each farm in your portfolio are visible at all times, so before you benchmark, you know you’re comparing like with like.

By mapping out what you’re doing on Figured, you can see: right, I’m doing this, this is the result, this is our feed inputs, this is the output from the cows. I use Figured probably too much — I use it a lot, I log in on my phone a lot. It’s an awesome tool for me to road map our year.
Figured is an online cloud tool that enables clients to plan their cashflow scenario planning for one to five years into the future. Its ability to look at profitability on the farm and not just focus on cash gives a great understanding about how the business is performing.
We think Figured is a great tool for the financial management reporting side of things. It allows the opportunity for us to help clients establish a great structure around their financial reporting system that actually gives them meaningful information out the other end.
Integrations
Figured doesn't replace your existing software — it plugs in on top, pulling live data from Xero, QuickBooks Online, or MYOB, and integrates with the apps you already use to manage the farm.
Xero
Accounting
MYOB
Accounting
AgriWebb
Farm Management
Agworld
Farm Management
FarmIQ
Farm Management
Xero
Accounting
MYOB
Accounting
AgriWebb
Farm Management
Agworld
Farm Management
FarmIQ
Farm Management
Xero
Accounting
MYOB
Accounting
AgriWebb
Farm Management
Agworld
Farm Management
FarmIQ
Farm Management
Trev
Farm Management
Farm Source
Dairy Processors
Synlait
Dairy Processors
Open Country
Dairy Processors
Miraka
Dairy Processors
Westland
Dairy Processors
Trev
Farm Management
Farm Source
Dairy Processors
Synlait
Dairy Processors
Open Country
Dairy Processors
Miraka
Dairy Processors
Westland
Dairy Processors
Trev
Farm Management
Farm Source
Dairy Processors
Synlait
Dairy Processors
Open Country
Dairy Processors
Miraka
Dairy Processors
Westland
Dairy Processors
If a client’s feed costs are running above the regional average for their area, detailed benchmarks tell you exactly how far above — and what top-quartile farms in their region are spending instead.
That type of data gives dairy accountants the information they need to tune their advisory conversations, moving from a general check-in to targeted advisory before the next season is locked in.

When a client weighs their next capital decision, benchmarks give you context for their numbers that reflects reality across the country. A farm tracking well below its peers on operating surplus tells a different story about expansion than one in the top quartile.

For bank reviews and lending conversations, benchmarks provide the external context that can add serious weight to your financial case.
Pull the benchmark report and include it alongside your cashflow projections and management summaries, helping you to prove that the current plan has precedent in the market — and may even outperform it. With the methodology published in each report index, uncertain lenders can feel confident that the statistical analysis is accurate.

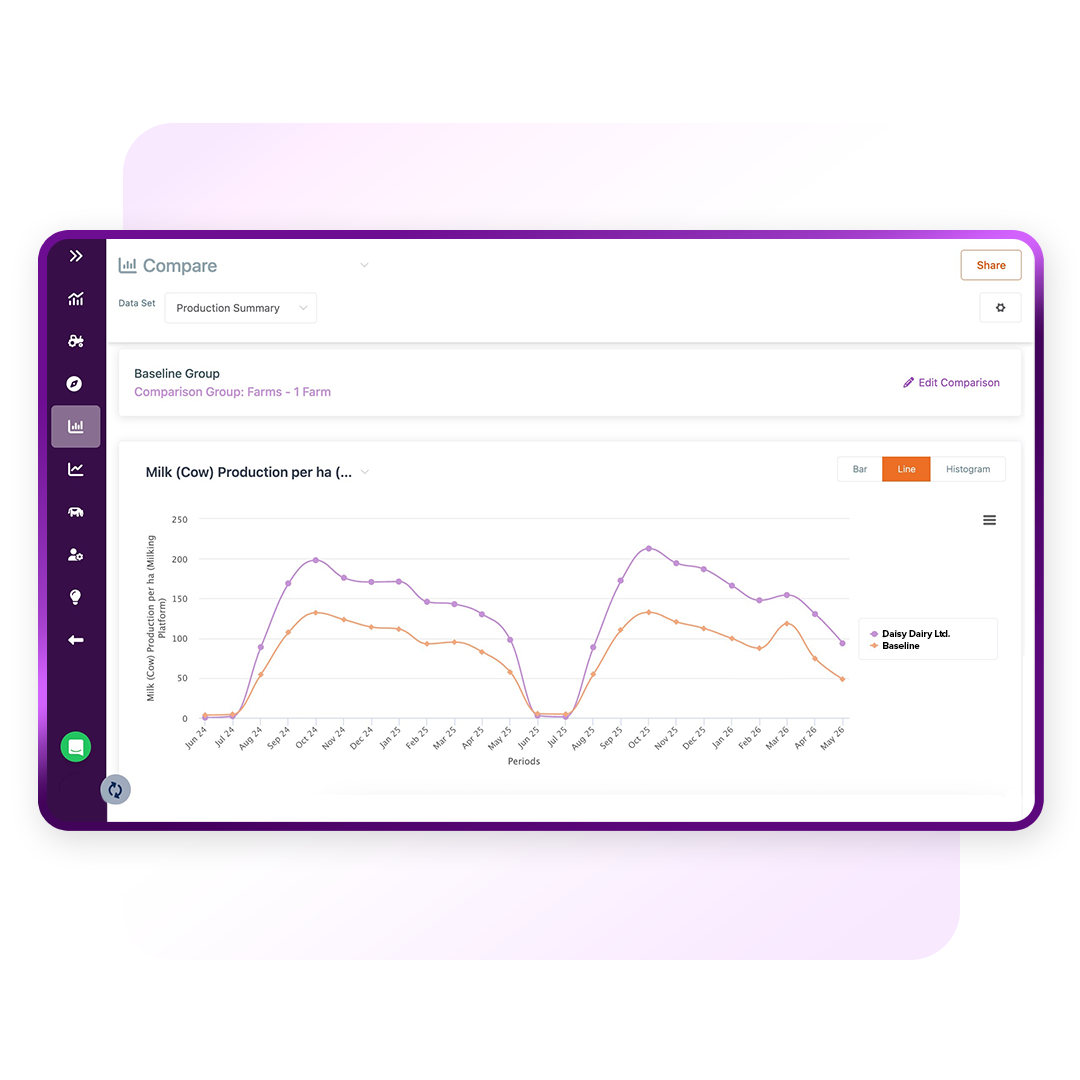
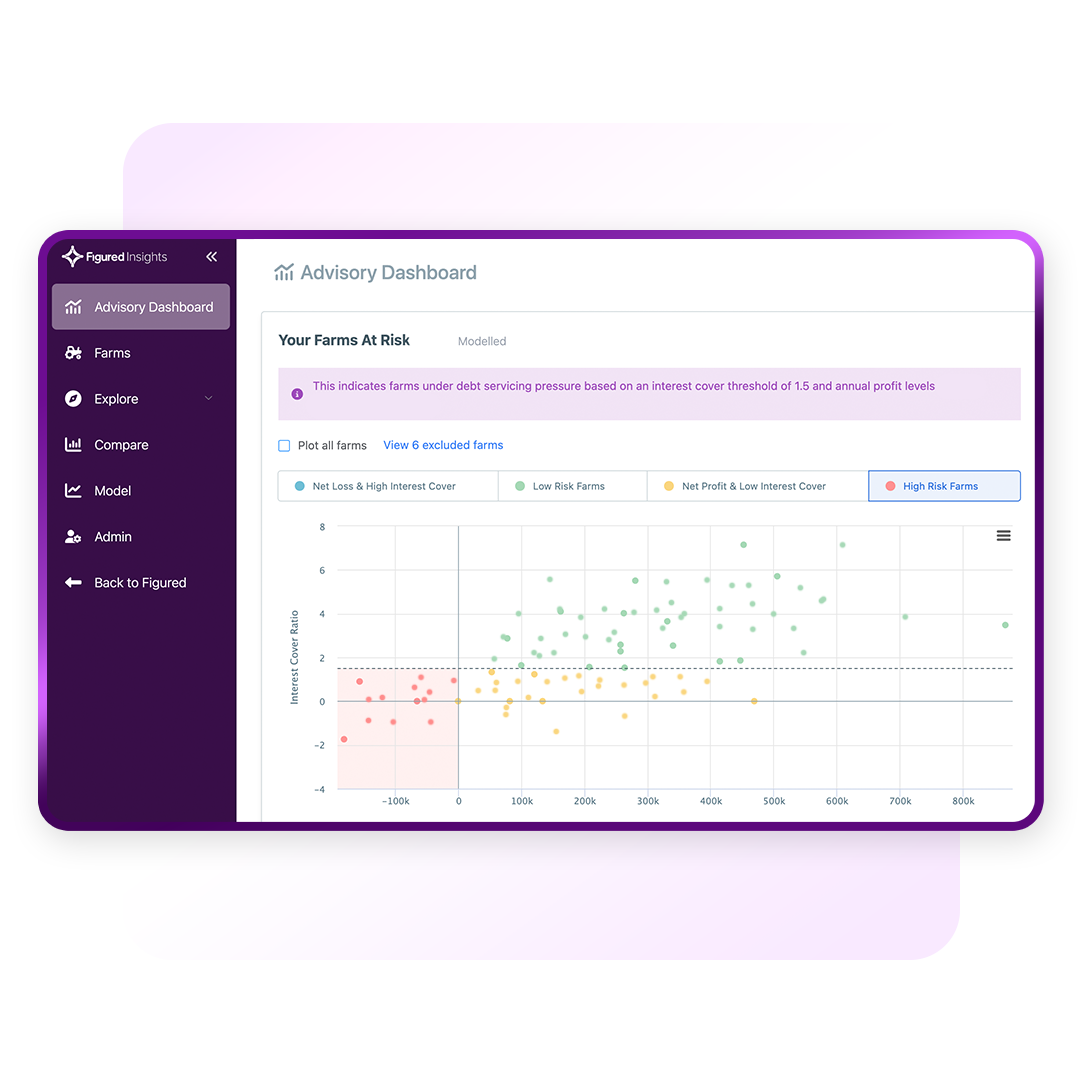
Figured Benchmarking lets you compare your dairy clients against each other across financial and production metrics. Use custom filters to review which farms in your portfolio are underperforming against comparable peers, and when a client’s numbers are significantly out of line, you have the trigger for a proactive conversation.

Earn recognition for the advisory work you’re already doing — and get found by the farming clients looking for an adviser who knows Figured.


![2015 Leech and Partners Master_CMYK[1]](https://www.figured.com/hubfs/Website%20Images/logos/customers/leech-partners-logo-white.png)


![2015 Leech and Partners Master_CMYK[1]](https://www.figured.com/hubfs/Website%20Images/logos/customers/leech-partners-logo-white.png)


![2015 Leech and Partners Master_CMYK[1]](https://www.figured.com/hubfs/Website%20Images/logos/customers/leech-partners-logo-white.png)


Resources
Questions
Figured’s national dairy benchmark report is currently available for NZ dairy clients only.
However, custom benchmark pools can be built from any farm type in your portfolio, including livestock and cropping clients within Figured Insights.
For dairy-specific comparisons against verified industry data, the national benchmark report covers all five NZ dairy ownership types, filtered by region and supplier.
Figured’s national dairy benchmarks are built on current-season verified actuals, refreshed each season and available as much as 12 months or more ahead of any other NZ benchmarking source.
The national benchmark report is built from 2,000+ carefully selected NZ dairy farms that meet strict data quality criteria. Every benchmark group requires a minimum of 50 farms. Outliers are removed using statistical methods and the full methodology is published in each report's appendix.
The national benchmark report can be filtered by region, supplier, and ownership type. National and regional averages, plus top-quartile data, are also available.
The national benchmark report is available to firms with Figured Insights enabled.
Those users can access the national benchmark report directly in Reporting Studio under Custom Reports, which pulls the data from your eligible dairy clients' files automatically.
For custom benchmark pools, head to the Benchmarking tab, add your farms, set your filters, and Figured builds the comparison. Figured fully anonymises and aggregates all benchmarking data, so no individual farm, firm, or client is identifiable.
Benchmarking is included as a part of Figured Insights, which is priced based on the number of farms in your subscription. For a full list of Figured’s products and pricing, see our pricing page.