For Dairy Farmers

Compare Your Farm’s Performance with Your Neighbour's
Ask your accountant how Figured Benchmarking can show how your business performance stacks up against thousands of verified NZ dairy farms β€” revealing the gaps you couldn’t see alone.
  • Verified benchmarks from 2,000+ NZ dairy farms.
  • Filtered by region, supplier, and ownership type.
  • Available through accountants on Figured Insights.

C_Rutherford-0191

Trusted by New Zealand Farmers

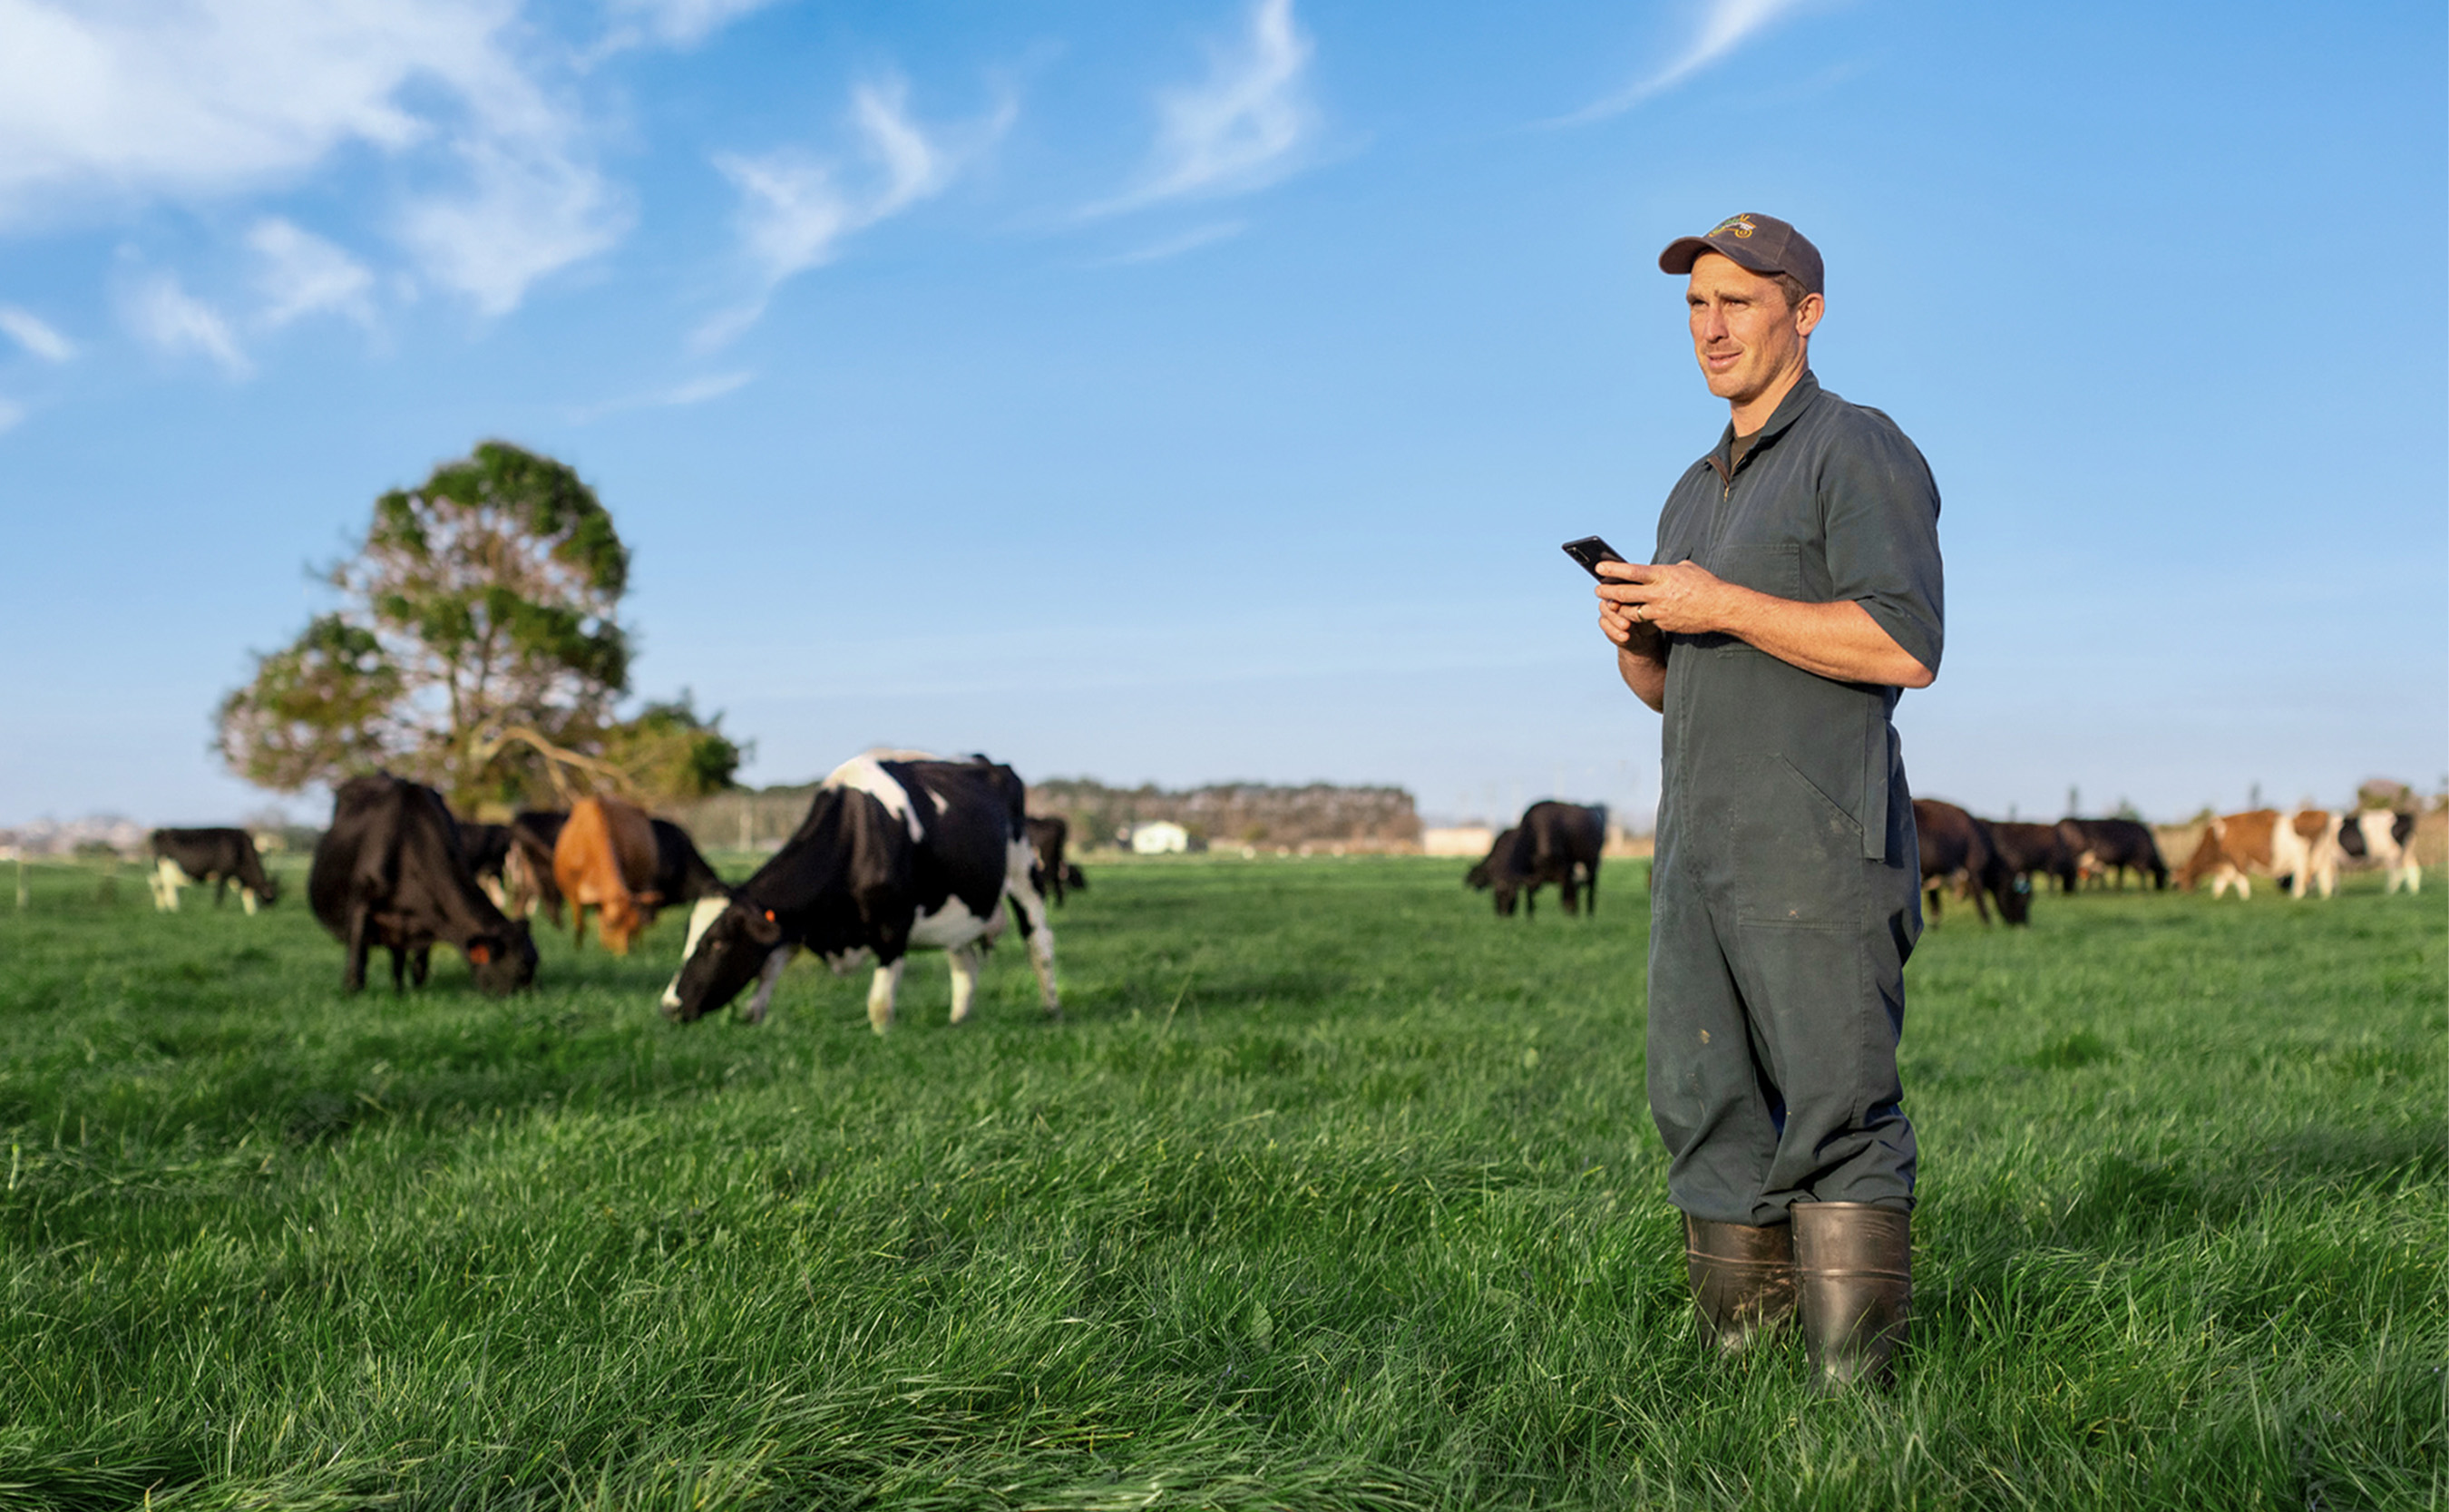
A dairy farmer checking his phone in a paddock, herd grazing behind him
35,000+ Farms on Figured
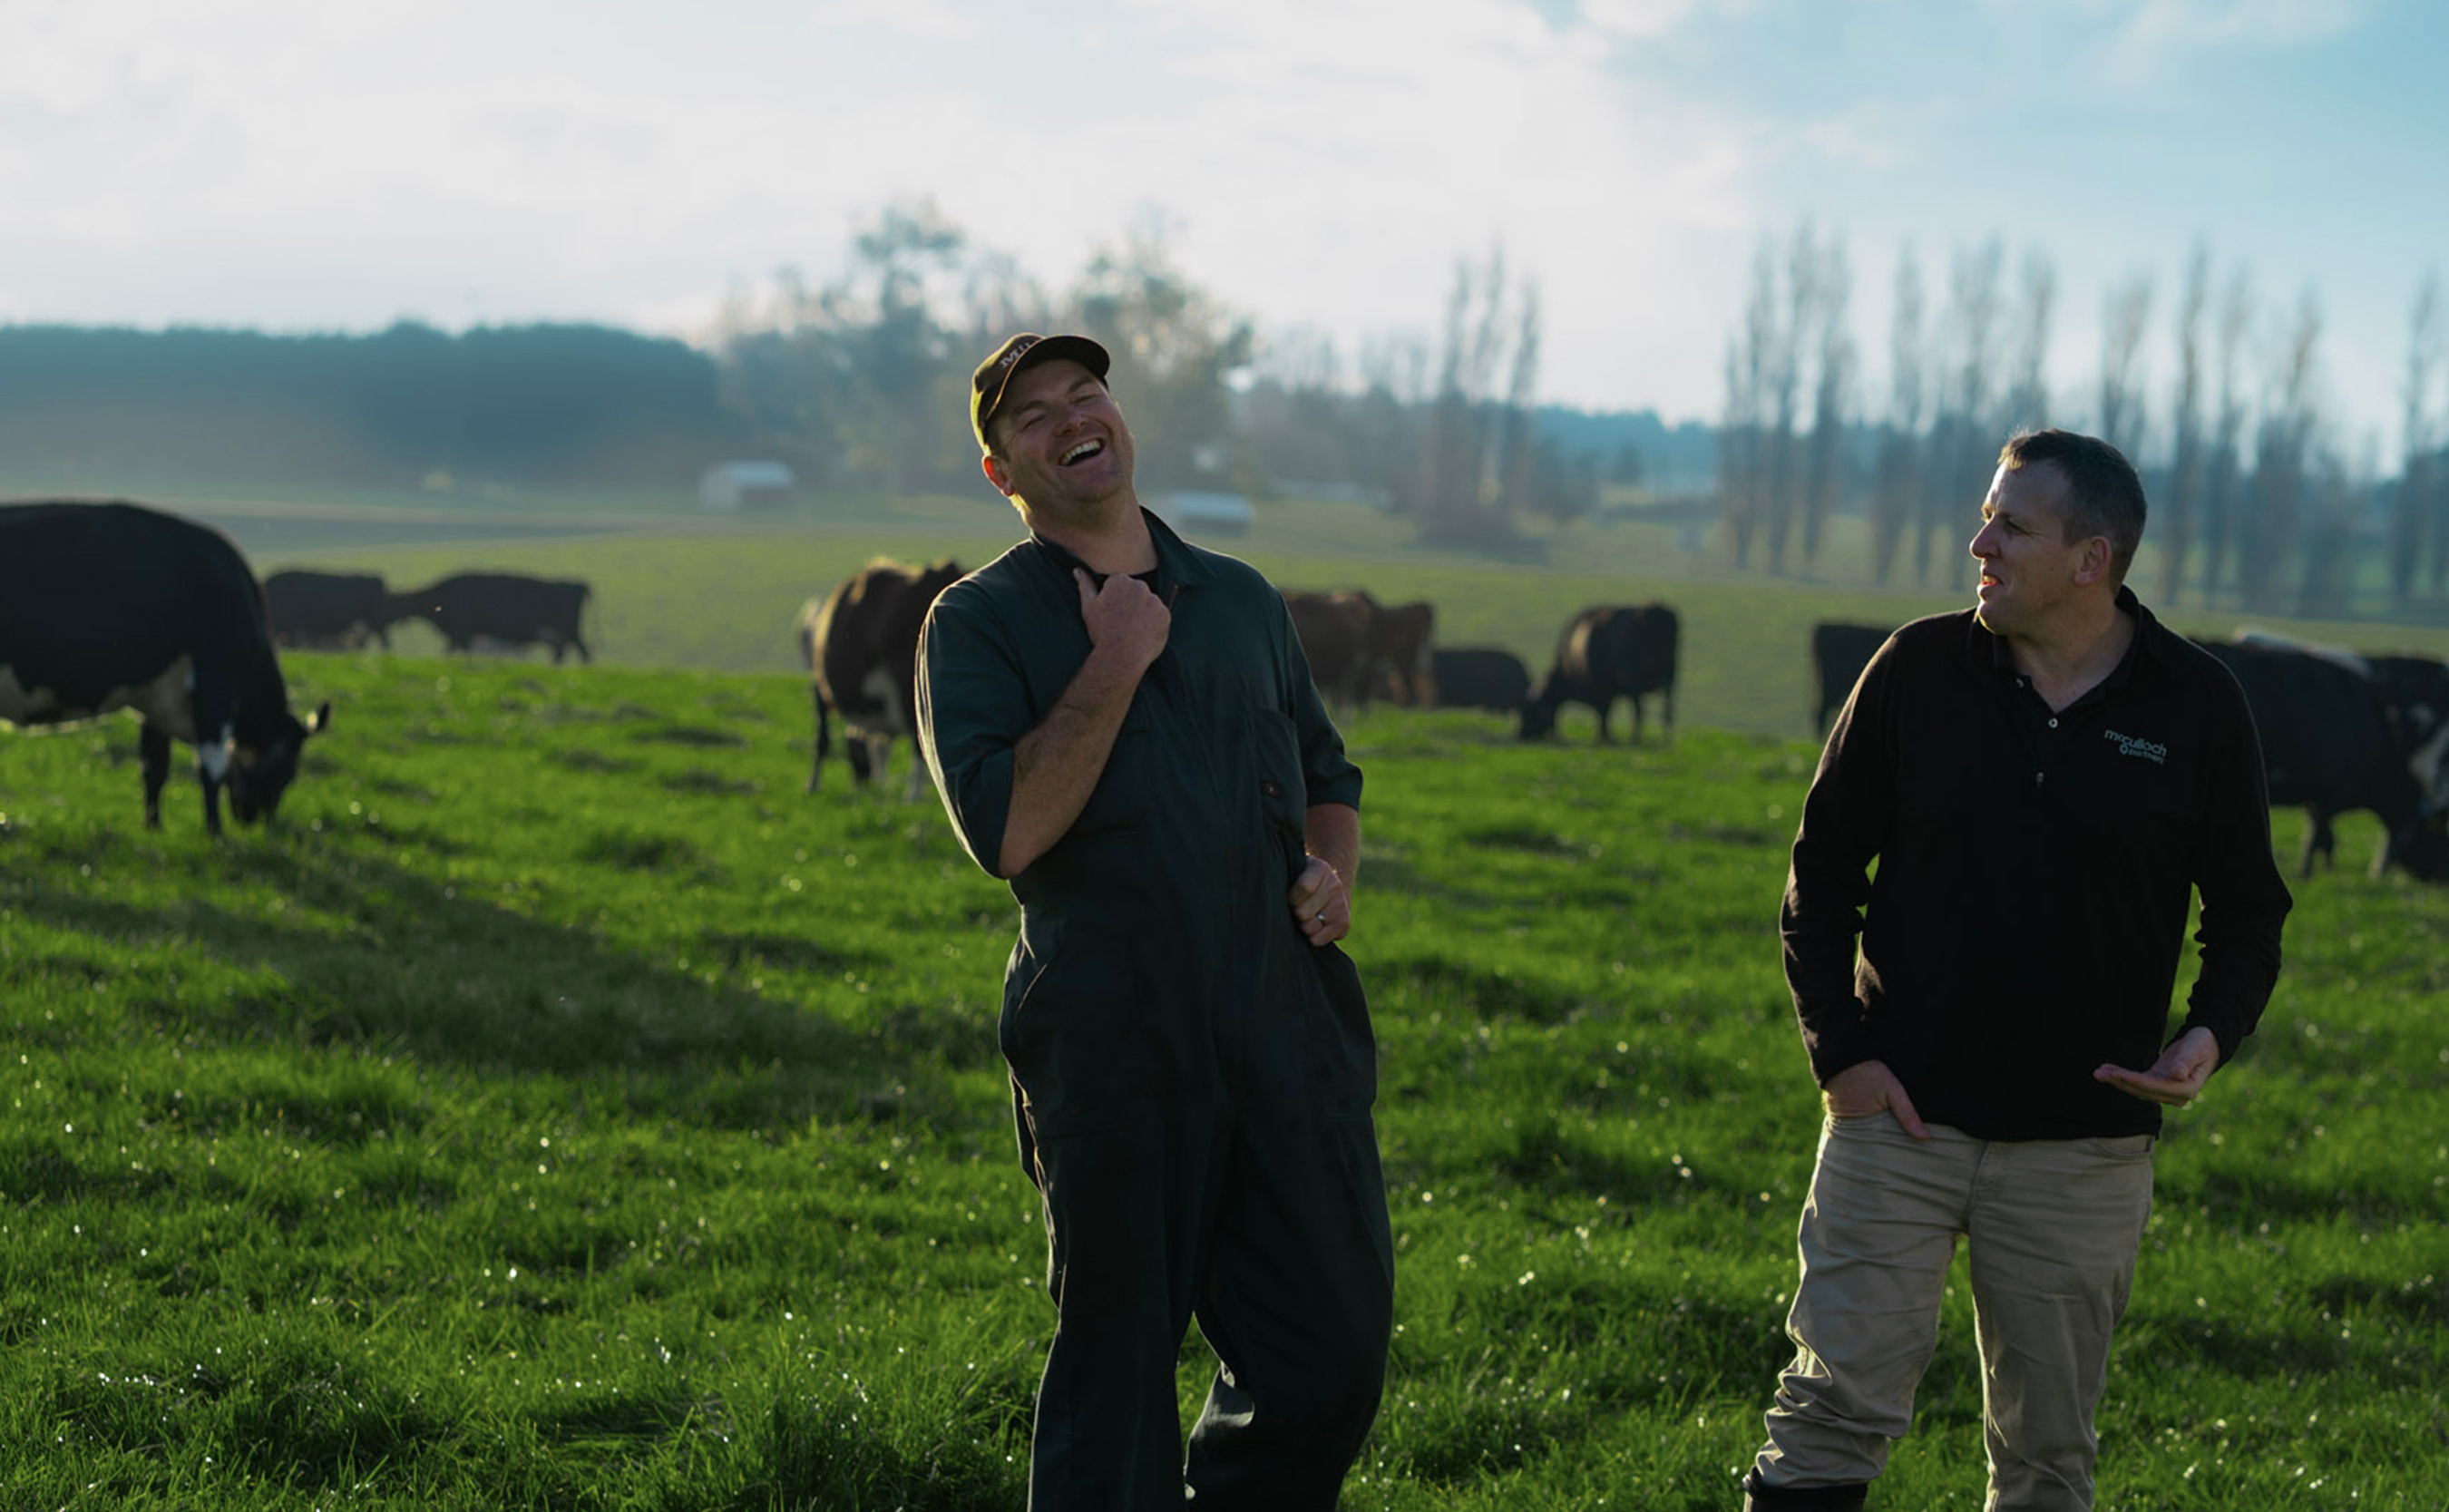
A dairy farmer and his adviser sharing a laugh in a paddock, herd grazing behind
Over $5 Billion in Farm Revenue Managed
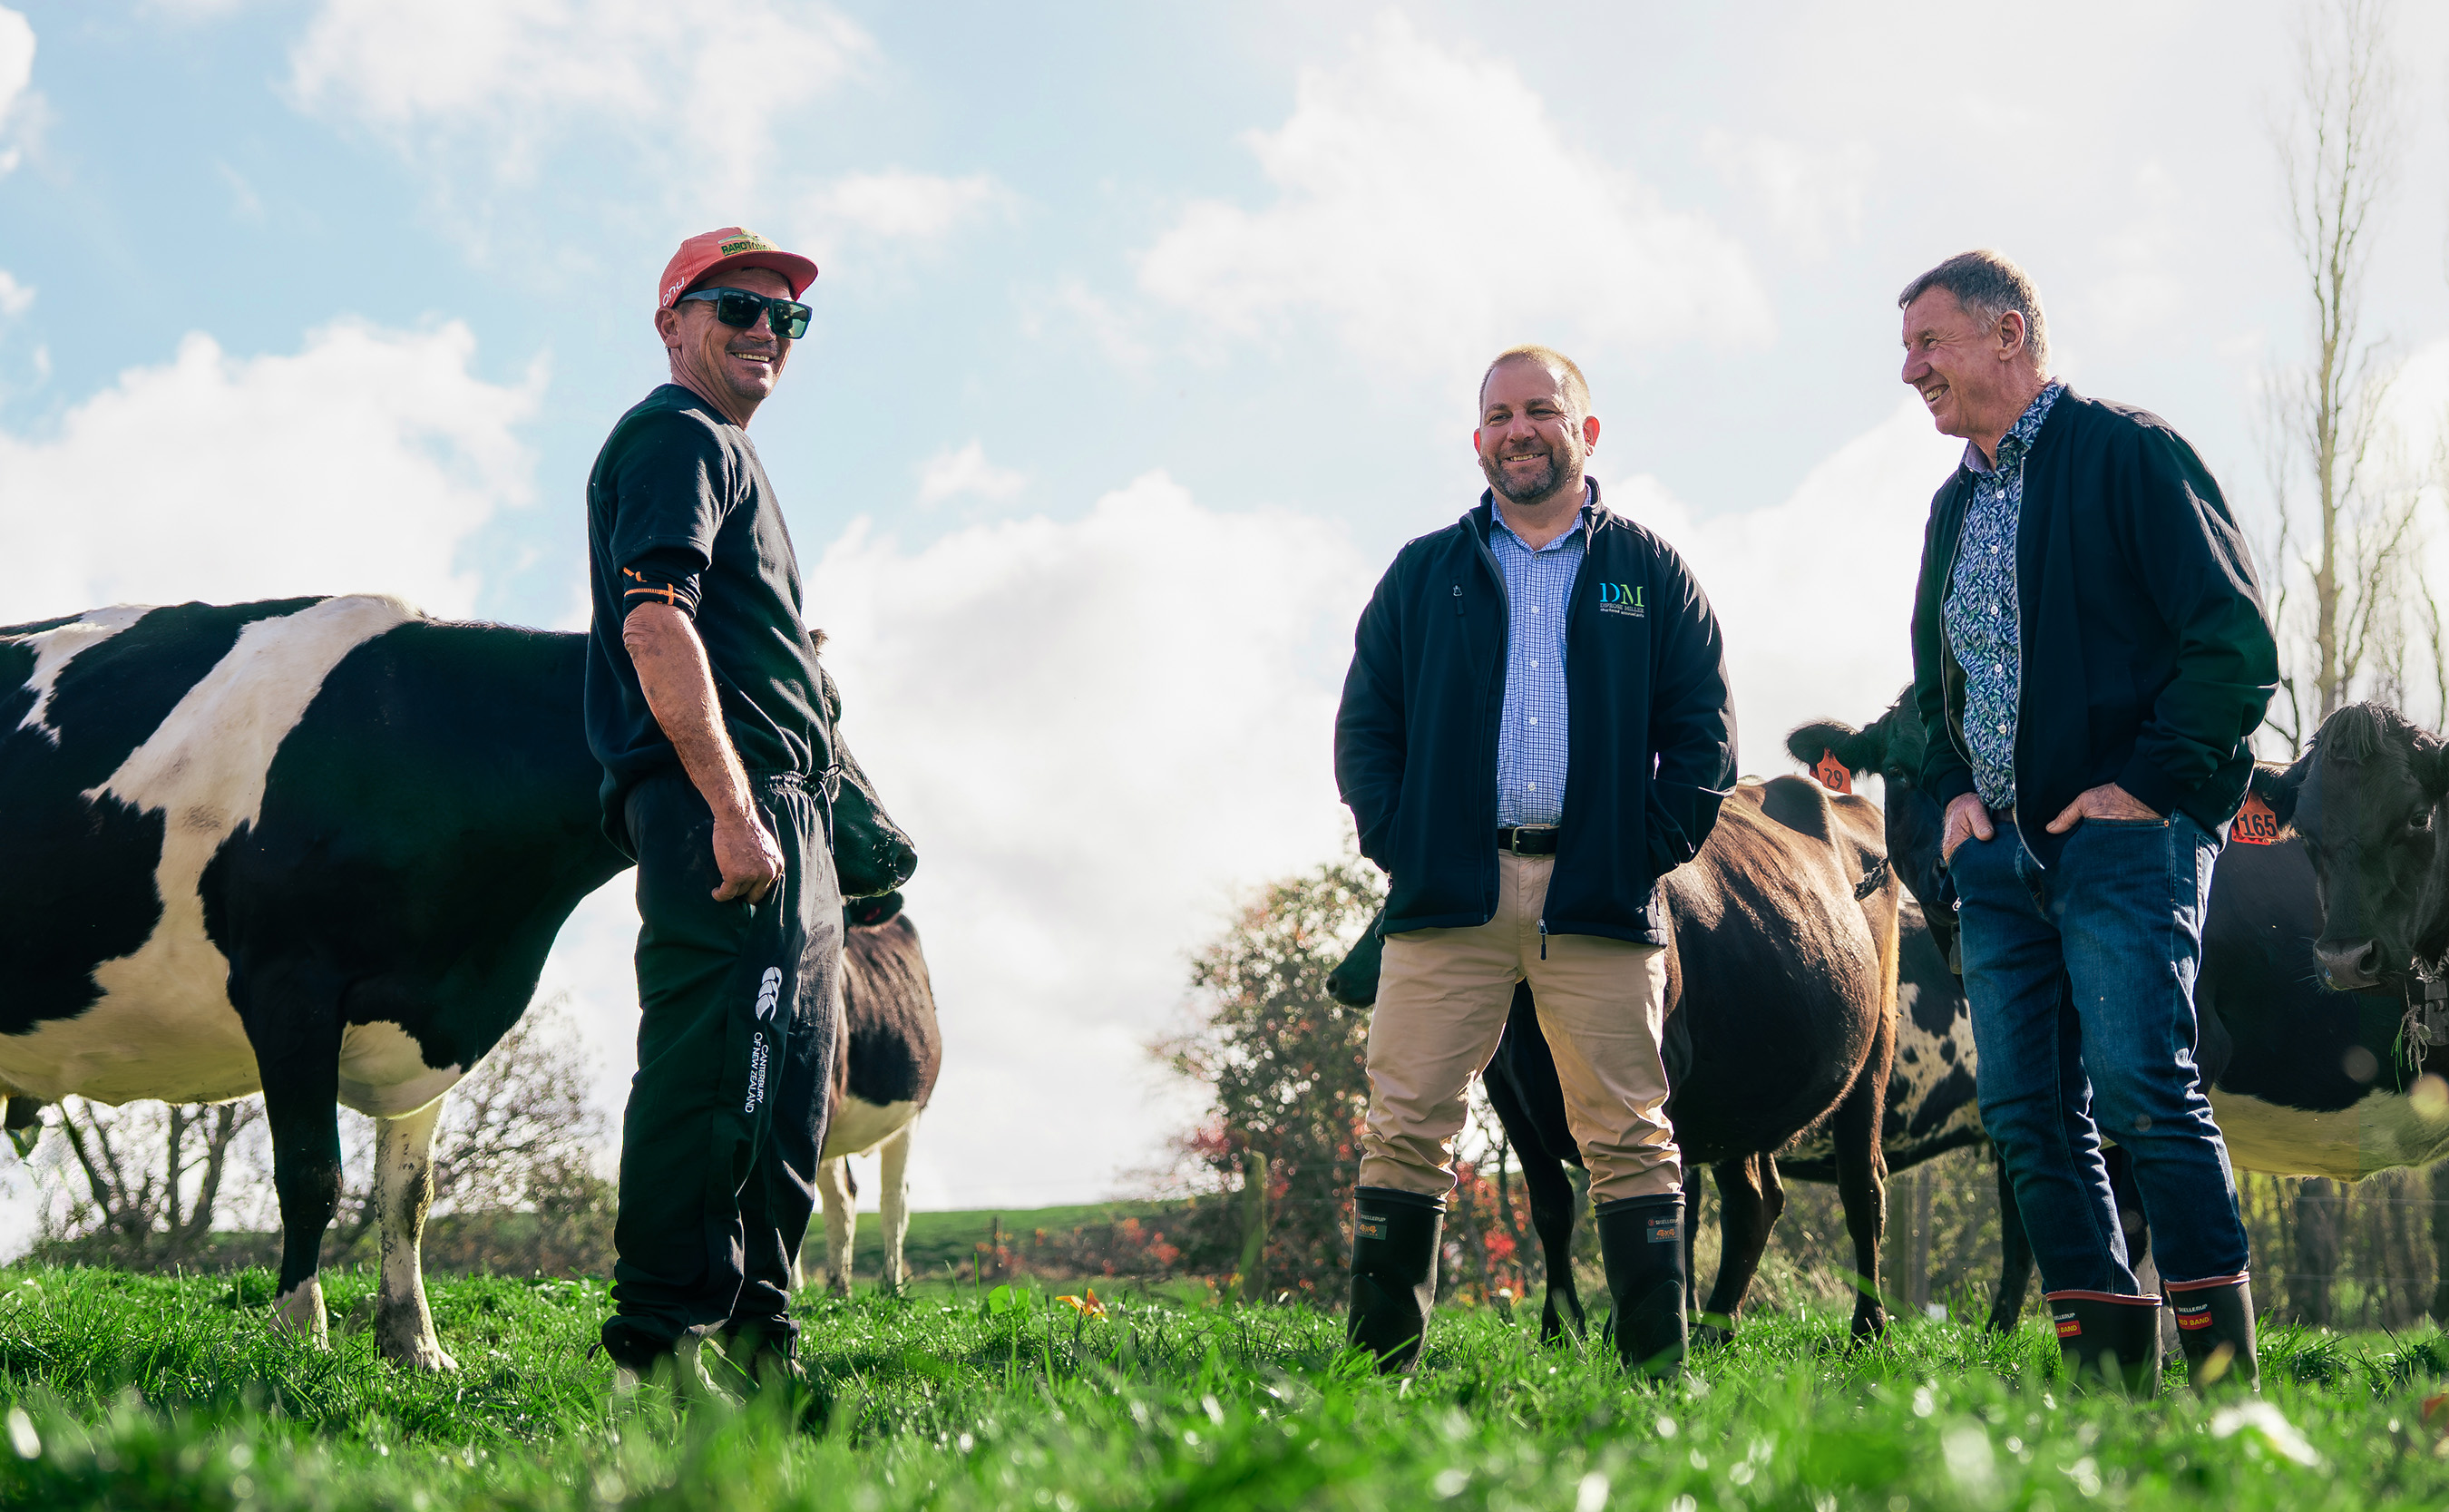
A dairy farmer and two advisers talking together in a paddock, herd around them
Nationwide network of over 95% of NZ's Agri Accountants
Sound Familiar?
β€œThe season felt good, but we’ve got no idea how we compare to other farms like ours.”

Even when you talk to other farmers regularly, if you’re measuring farm performance in isolation, it’s hard to tell how you stack up.

It can look like costs are trending up despite your best efforts, but actually on the regional level you’re outperforming everyone else. Or the alternative β€” like-for-like comparisons show you that there are some real cost optimisations to be made.

That’s the power of Figured Benchmarking.

What You’ll Get From Figured Benchmarking

Regional Benchmarks

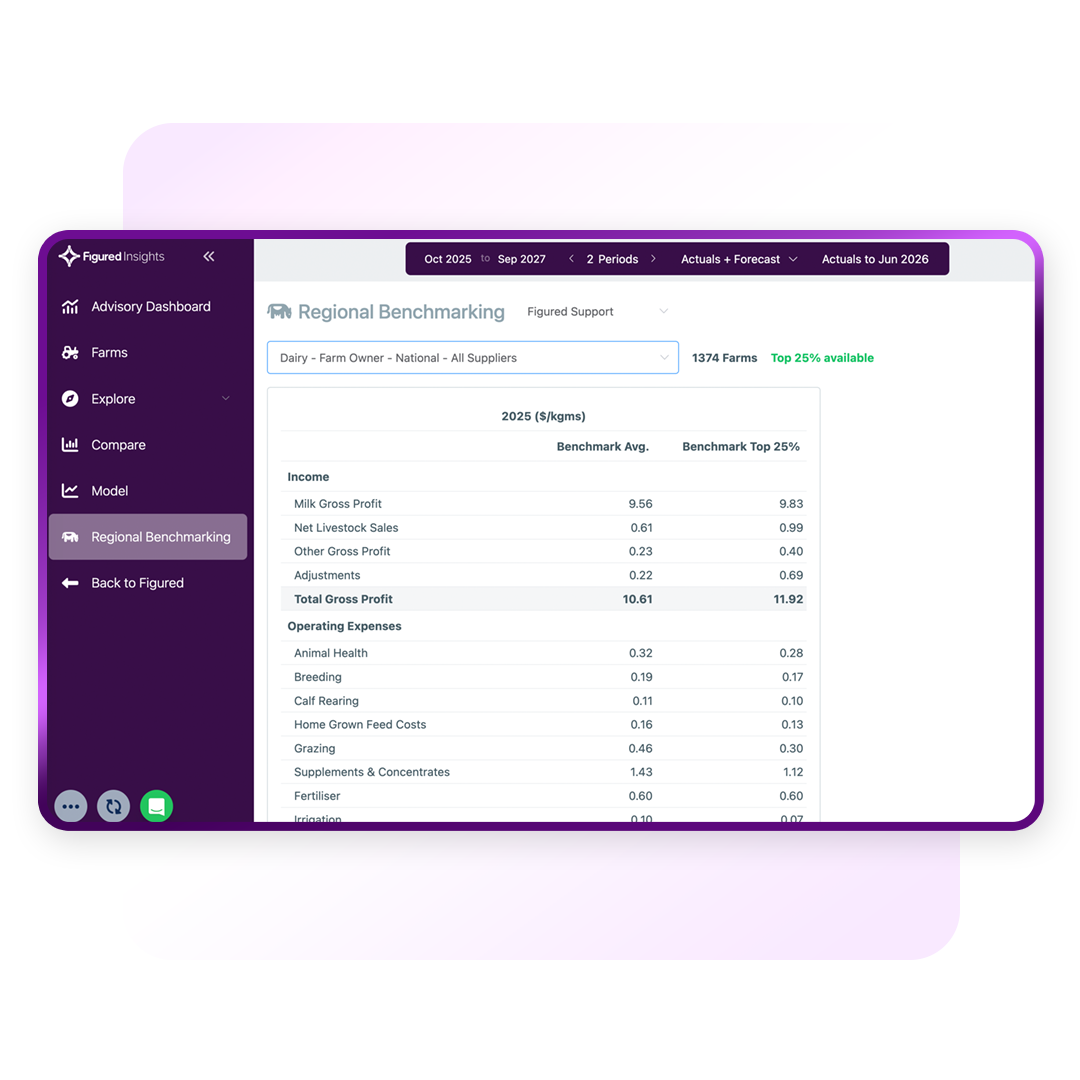
Compare Your Farm to Thousands of Verified Peers

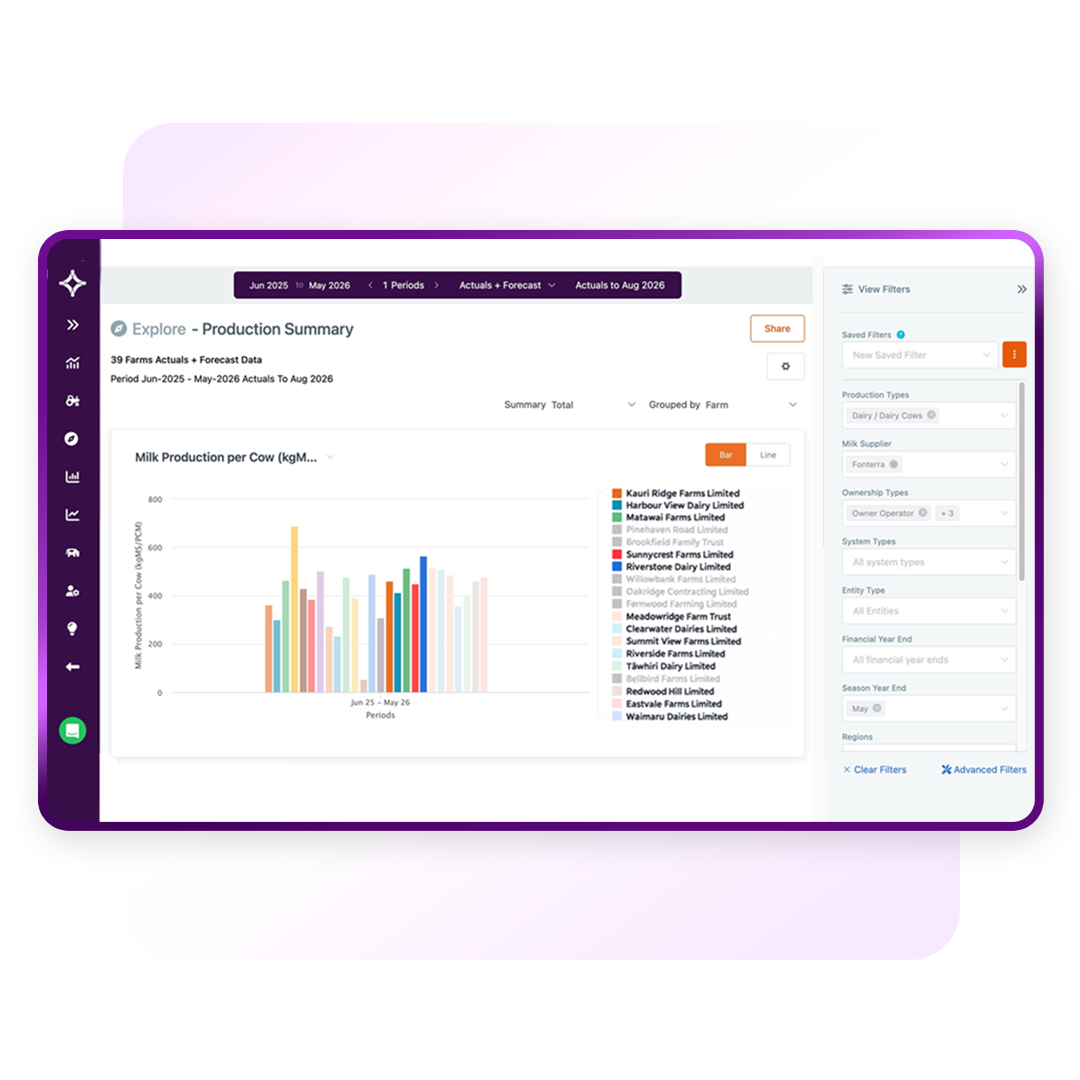
Figured’s National Dairy Benchmark Report draws insight from over 2,000 verified NZ dairy farms, which your accountant can filter by region, ownership structure, and supplier. You’ll be able to see how your income and expenses compare not just to dairy farmers generally, but those whose operations most accurately reflect your own.

fi-product-image-square-production-summary2

Top-Quartile Data

See Where Your Farm Sits Against the Best in Your Category

Top-quartile farms (top 25% by operating surplus per kgMS) show how your own operation compares to the best in your region. When your costs or operating surplus sit materially away from that benchmark, you and your accountant have something concrete to plan against: β€œHow do we get there too?”

fi-product-image-square-benchmarks

Finding Benchmarking

Available Through Your Figured Accountant

Figured Benchmarking data is available through any NZ agri accountant subscribed to Figured Insights. There’s no set-up required at your end other than using Figured normally for production tracking, reconciliation, and planning.

Unlike many other dairy reports, which pull out estimates, Figured Benchmarking data compares regional benchmarks with the same financial data your accountant already works with in Figured. What you see is based on your real farm numbers, and those of your closest peers.

Team-Canterbury Dairy-1-Square-NZ

Data Quality

Verified Data You Can Rely On

Figured’s benchmarks are built on verified actuals from NZ dairy farms actively managed in Figured. Eligibility criteria are strict: farms must have at least nine months of kgMS data, generate at least 60% of revenue from milk income, and have an active connection to both platforms.

Every benchmark group requires a minimum of 50 farms, outliers are removed using statistical methods, and the full methodology is published in each report’s appendix. When your accountant brings these comparisons to your review, you’ll know they stand up to scrutiny.

multi-farm

See Where Your Dairy Farm Sits Against 2,000+ NZ Operations

Find a Figured-certified accountant to get started.
Find an Adviser

Now with Figured, it has absolutely shifted our whole outlook on the business. I just can’t wait to be using the reports to analyse and approve decisions β€” we’ve never had time to do that before, we’ve been too busy just getting the information.

Tracey McNeil
Tracey McNeil McNeil Farming

The beauty of Figured is that it helps you look forward. It gives you a picture, and it might be six to 12 months down the road of where you’re going. If you don’t like that picture, you’ve got that time to change. It’s just better than looking back at last year’s numbers when it’s a bit late to make a change.

Doug Kelly
Doug Kelly Paistex Pastoral Co.

I didn’t have a lot of confidence in my spreadsheet and my formulas. Whereas with Figured, I know they’re all over that. It gives me a lot more confidence to know that the actual figures being pulled through are correct β€” and they’re getting pulled through in real time.

Pru Lynch
Pru Lynch Farmer

Integrations

Figured Works with the Software You Already Use

Figured doesn't replace your existing software β€” it plugs in on top, pulling live data from Xero, QuickBooks Online, or MYOB, and integrates with the apps you already use to manage the farm.

fm-product-image-square-partner-directory

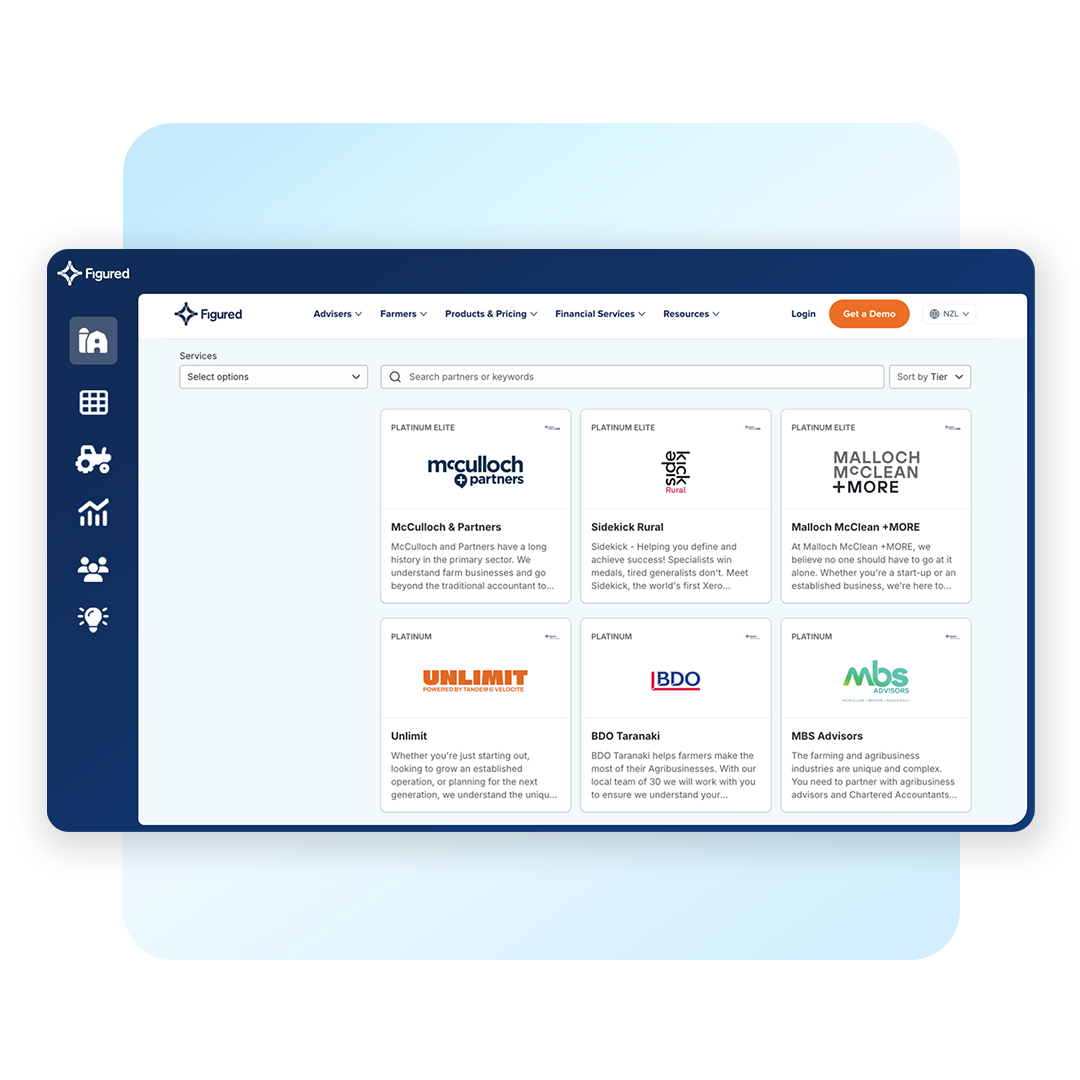
Find a Figured Adviser

Not Sure Where to Start? Work with a Certified Figured Adviser

Our network of Figured-certified agri accountants and advisers can help you get set up, manage your farm financials, and make better decisions β€” year-round.

Find Your Adviser

Partnered with NZ's top agri advisory firms

Questions

Figured for Farm Benchmarking β€” FAQ

Figured’s National Dairy Benchmark Report is currently available for NZ dairy operations only. It covers all five NZ dairy ownership types, including farm owner, farm owner with sharemilker, farm owner with contract milker, sharemilker, and contract milker.

Goat and sheep dairy farms are excluded to keep the comparison consistent across the dataset.

If you’re not on a dairy operation, your Figured accountant can discuss what reporting and comparison tools are available for your farm type instead.

The report compares your farm's P&L income and expense categories against other farms in your benchmark group, filtered by region, supplier, and ownership type. National averages and top-quartile results are included for every category.

Key metrics include operating surplus per kgMS, income per kgMS, and expense categories such as feed costs, wages, and animal health. Results are available on an accrual or cash basis, using Figured's standardised categorisation so the numbers are comparable across farms.

All benchmarking data is fully anonymised and aggregated. No individual farm or person is identifiable in any Figured Benchmark Report. The strict eligibility criteria also mean you’re only being compared against farms with complete and reliable data.

Benchmarking is only available through a Figured accountant set up on Figured Insights. If your farm runs on Figured and meets the eligibility criteria, they can pull the report directly from the Figured side with no extra setup required from you.


Don’t have an adviser? Check out our trusted partners: Find an Adviser

Figured’s dairy benchmarks are built on current-season verified actuals, updated each season and available 12 months or more ahead of any other NZ benchmarking source.

Benchmarking is included with Figured Insights, which is a premium product for your accountant. If your farm and accountant are already on Figured, ask them whether Figured Insights is part of their subscription.

Find the Gaps Between Your Farm and NZ Dairy’s Top Performers

Ask your accountant about Figured Benchmarking to see how your farm’s numbers stack up against similar operations across New Zealand.