For Agri Accountants

Live Farm Production Tracking that Connects Straight to the Financial Plan

Figured is the platform where on-farm production data connects in real time to live actuals. See what’s happening across your clients, and what it means for the numbers, all year round — without rebuilding spreadsheets from scratch.

  • Milk, livestock, wool, and crop activity tracked in one place.
  • Production data flows automatically from key farm integrations.
  • Intelligent, agri-aware systems take on more of the manual work.
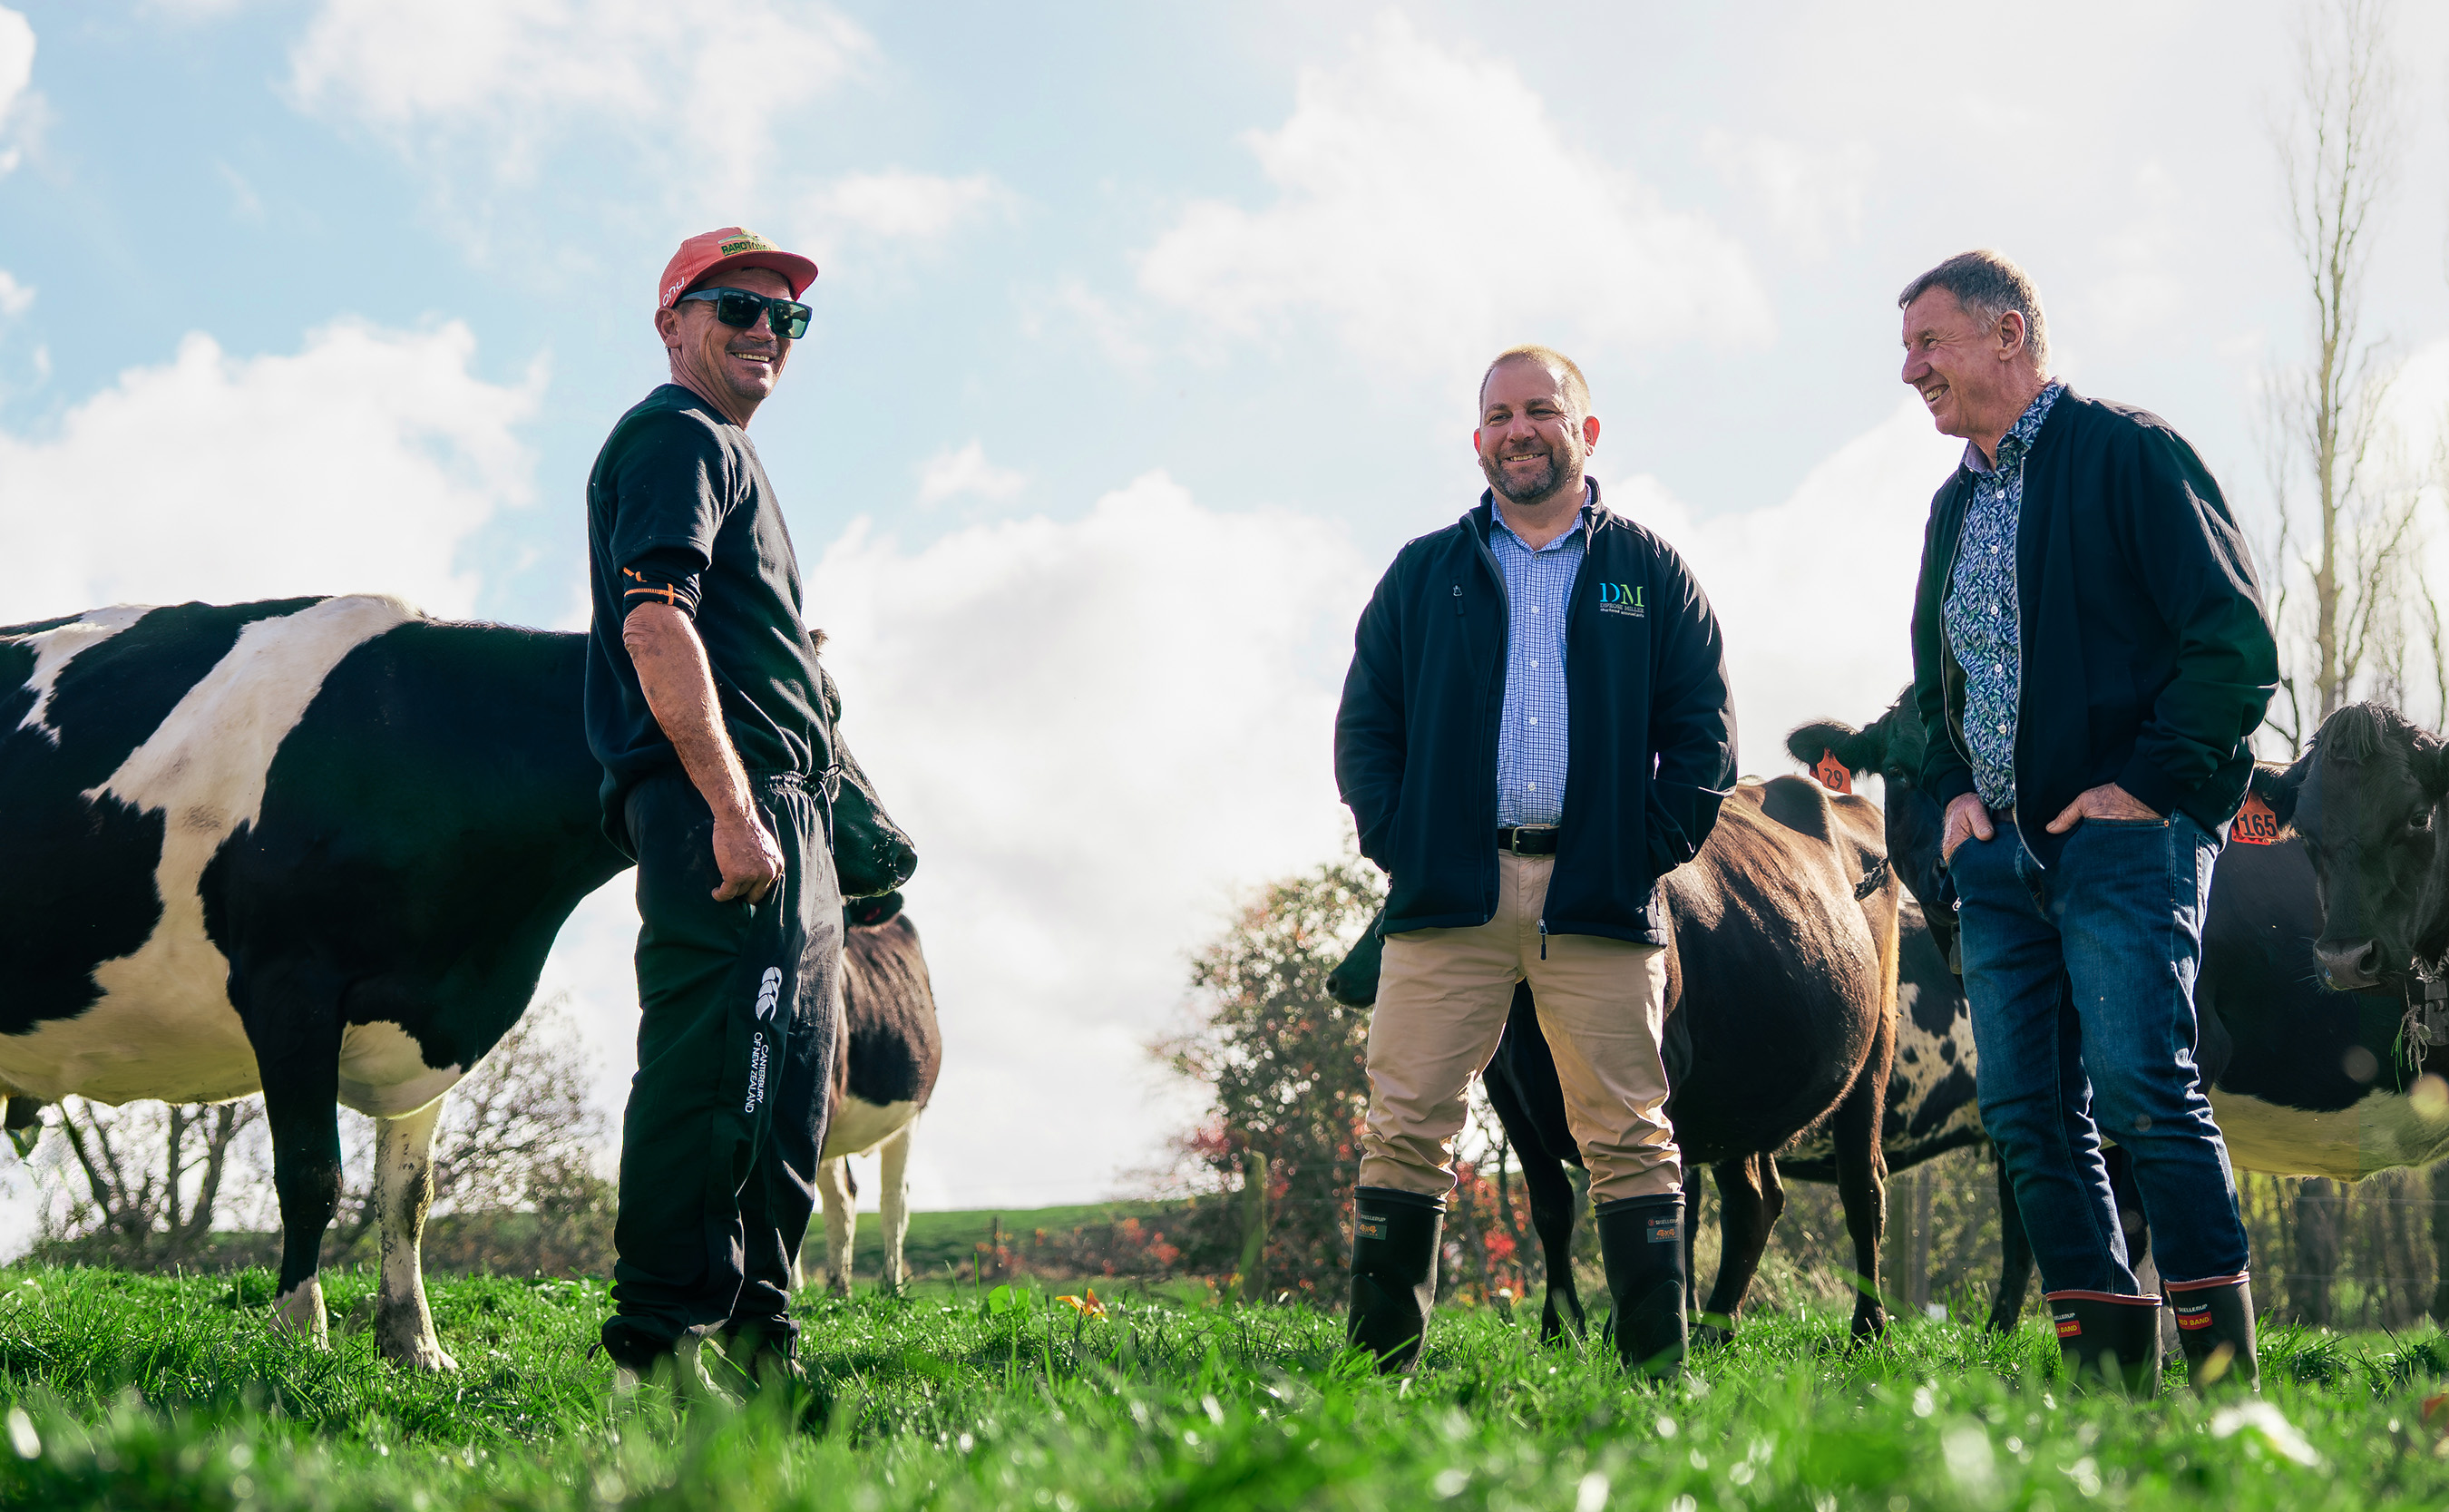
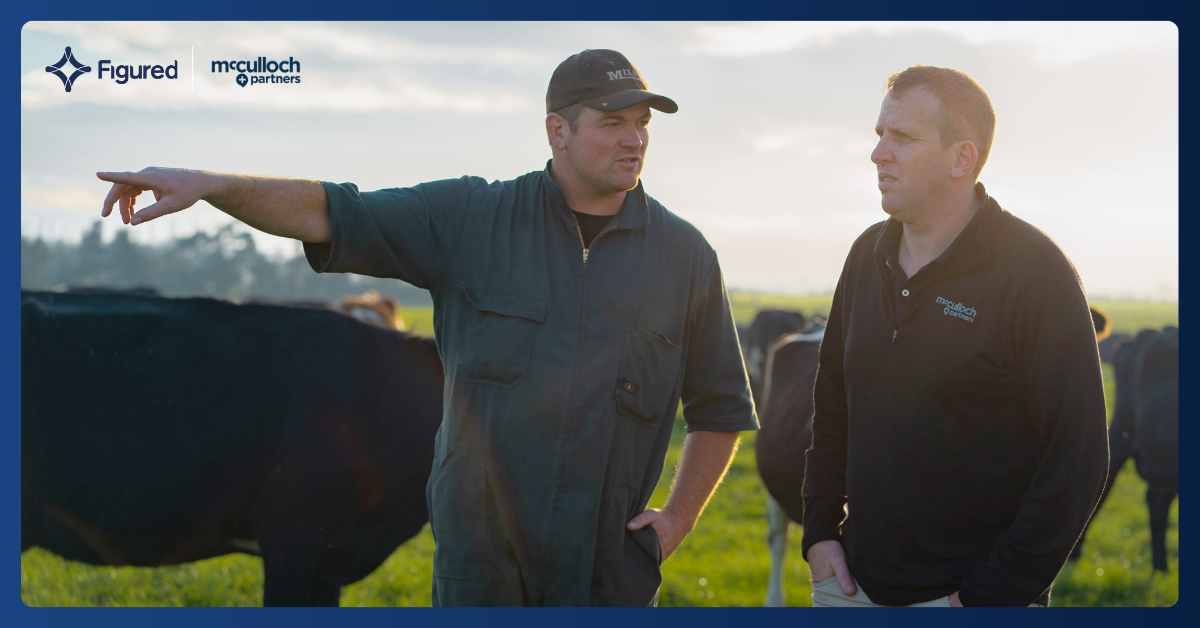
dairy-farmer-advisers-paddock-waikato-nz

The World’s Largest Farm Financial Management Platform

There’s a reason thousands of agri-accounting firms across New Zealand, Australia, the UK, and the USA run their farming clients through Figured. More than 35,000 farms trust the platform — and the advisers who use it every day know exactly why.

Heard This Before?

“When the financials look off, we have to call the client to find out why.”

Farm accountants are stuck: clients rely on them to understand their cash position, but accountants are often the last to find out what’s happening on the farm. Without that production data, it’s difficult to tell what the numbers are saying.

Traditionally, accounting data and production figures have lived in different places — one in Xero, the other in spreadsheets, or the farmer’s head. Most practices in New Zealand still work that way because the tools haven’t made it practical to change.

But some practices are working differently. They’re using a platform that not only draws from live actuals, but knows what’s happening in the paddock and the market. When the numbers move on one side, they can investigate what’s happening on the other.

That platform is Figured.

How Figured Simplifies Farm Production Management

Dairy

Milk Tracking that Can Handle a Volatile Season

Figured is built for dairy, which means everything you’d normally calculate in a spreadsheet — with all the formula errors and version control issues that come with it — live in Figured natively.

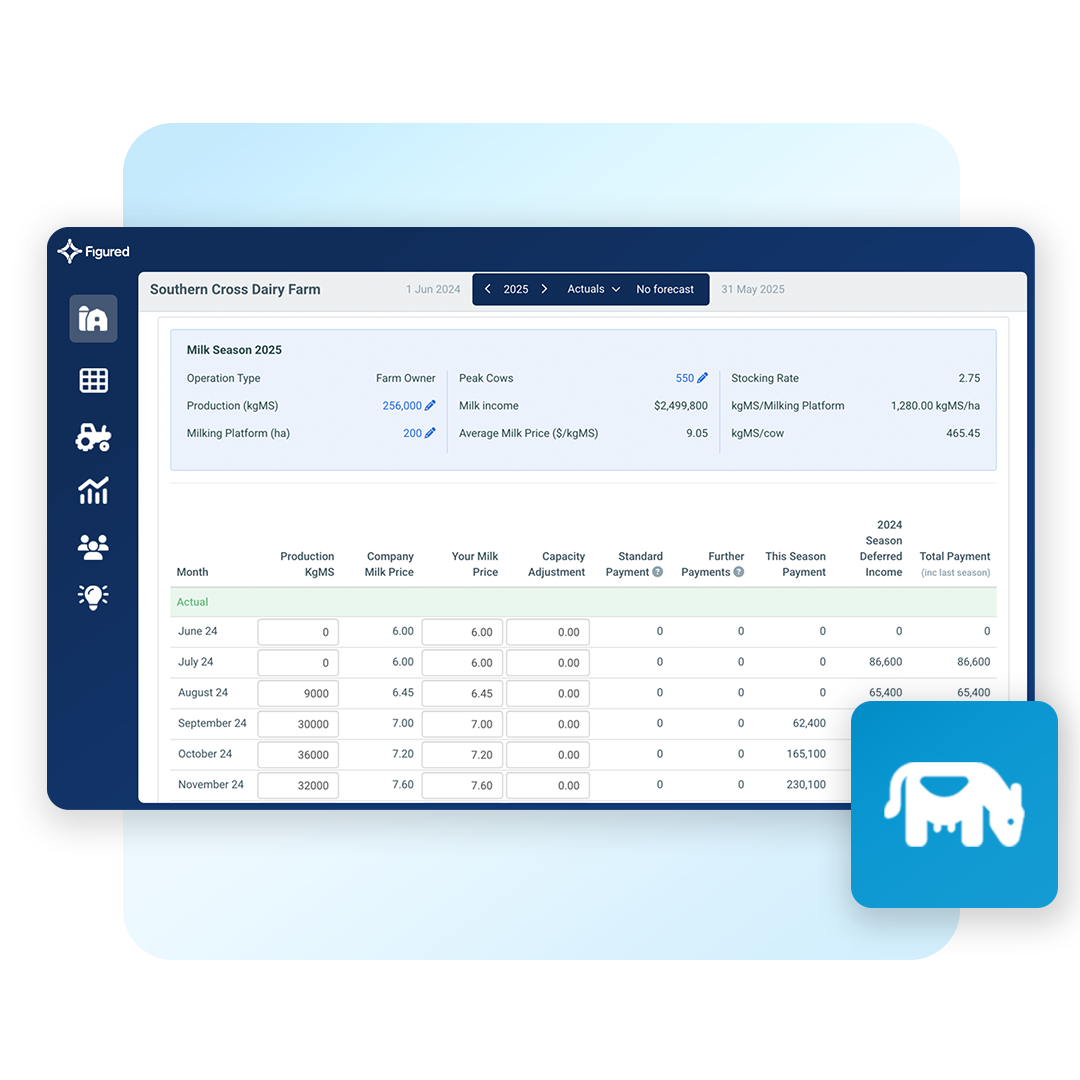
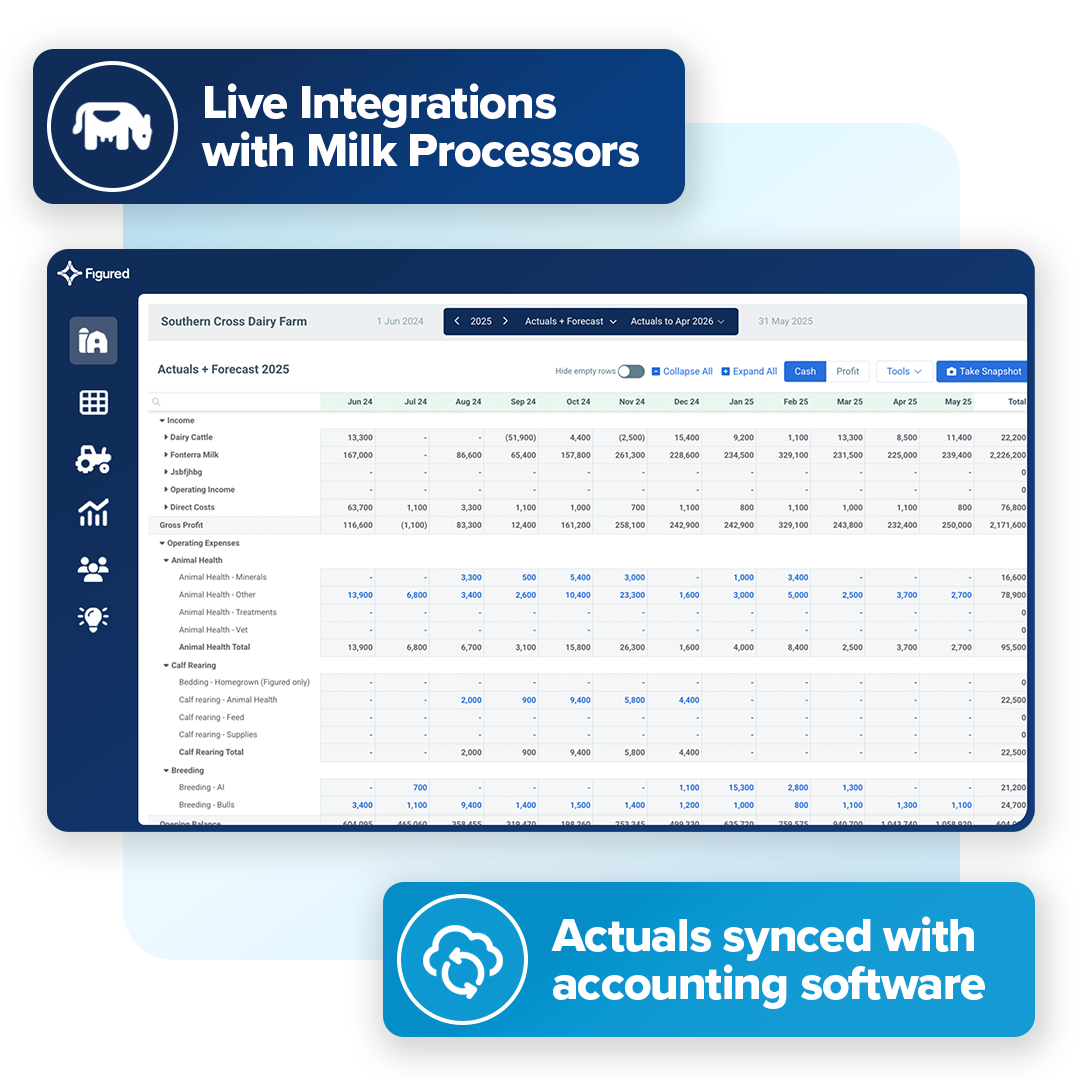
Set up a Milk Tracker per supplier and kgMS data feeds in automatically from Fonterra, Synlait, Open Country, Westland, and Miraka. Monthly milk price, seasonal adjustments, retro payments, deferred income, and DairyNZ levies all calculate from there, updating as the season moves — automatically applied to the right income split for sharemilker and contract milker operations.

When a payout revision comes through mid-season, the farm’s financial plan already reflects it, so accountants can monitor against forecast and model payout scenarios no matter how volatile the season.

Explore Dairy Advisory
fm-product-image-square-production-milk

Livestock

Stock Movements Connected to the Financial Plan

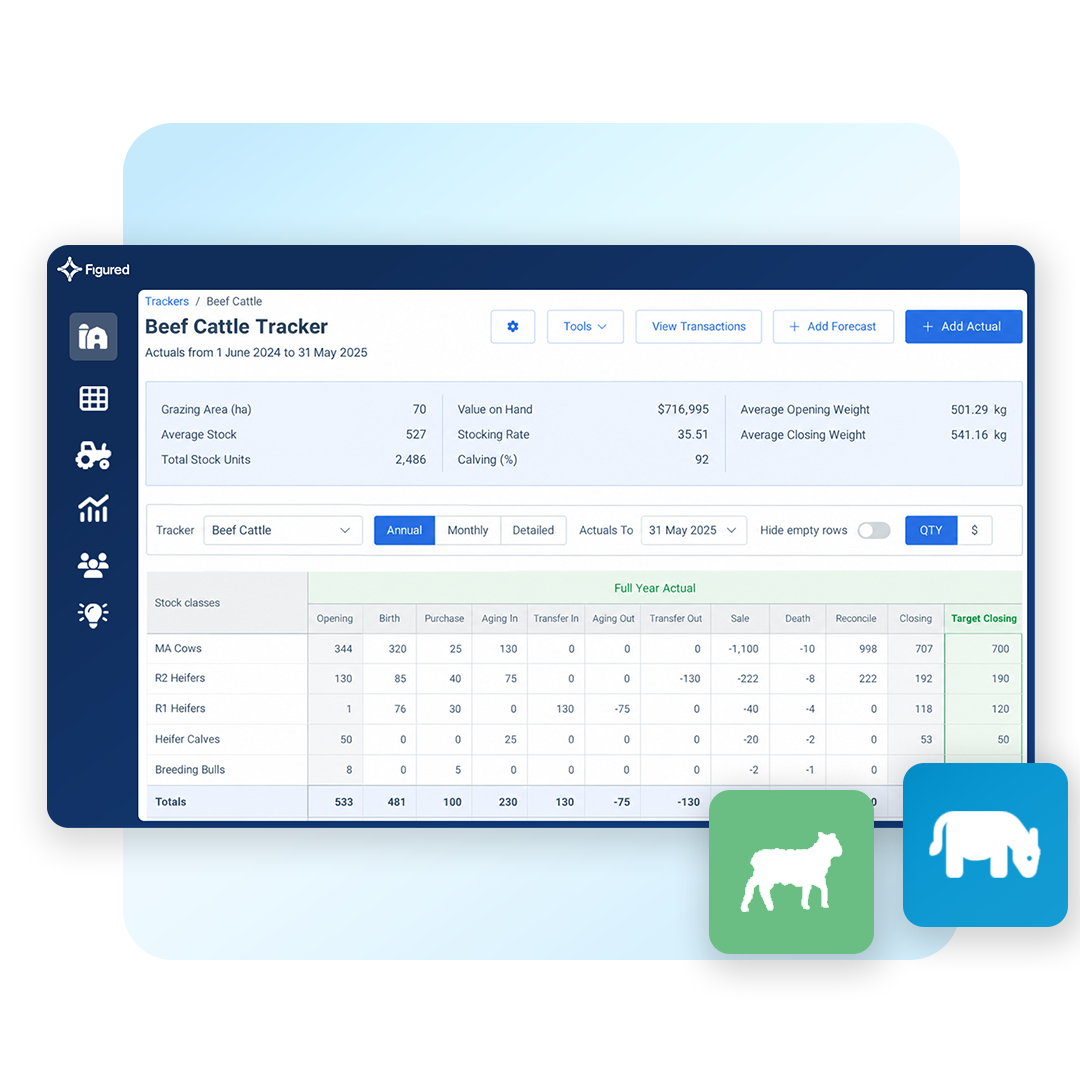
Figured’s Livestock and Wool Trackers record births, deaths, purchases, sales by stock class, and inventory, ensuring all on-farm production activity is recorded where it can feed directly into the financial plan — reconciled against Xero, MYOB, or QuickBooks Online with a click.

For NZ sheep and beef clients, Herd Scheme and National Standard Cost valuations update automatically when IRD publishes new rates. Plus integrations with key farm apps like AgriWebb bring stock movement records in automatically, so production data stays current without relying on the farmer to enter it manually.

Even killsheets scan themselves with AI, reducing manual data entry so you spend less time keying in numbers twice, and more time holding proactive advisory conversations.

Explore Livestock Advisory
fm-product-image-square-production-sheep-beef

Cropping

Crop Activity Down to Field and Crop Type Level

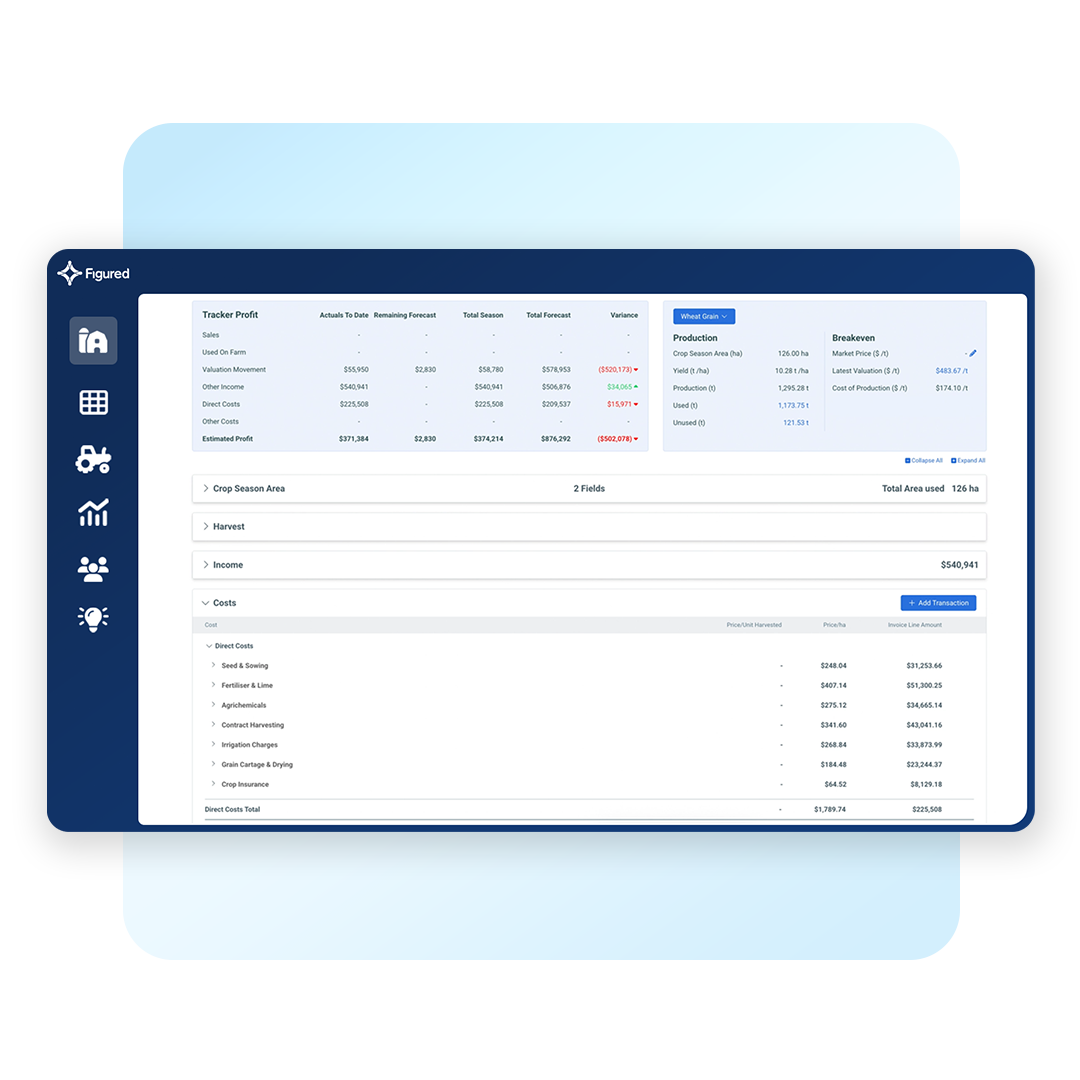
Figured handles cropping the way the season actually runs. Set up a Crop Tracker for each enterprise and record what’s being grown, what’s come off, and what’s been sold, by field or by crop type, with the financial impact flowing straight through to the budget.

The Inventory Tracker sits alongside it, holding harvested crop and purchased inputs like seed, fertiliser, and chemicals in one connected view. Then the Allocator links actual income and expenses from Xero, MYOB, or QuickBooks Online to the right crop season, splitting shared costs where they span multiple crops.

All the data you need for great advisory, in one shared view.

Explore Cropping Advisory
fm-product-image-square-cropping-budget

Custom Reporting

Reports that Show the Whole Farm Picture

With production and financial data in one platform, Figured reports take into account the whole farm picture. Everything you need to report to the family, trust, governance board, or lender is generated from data that’s been building throughout the year, ensuring it accurately reflects what’s really happening on the farm.

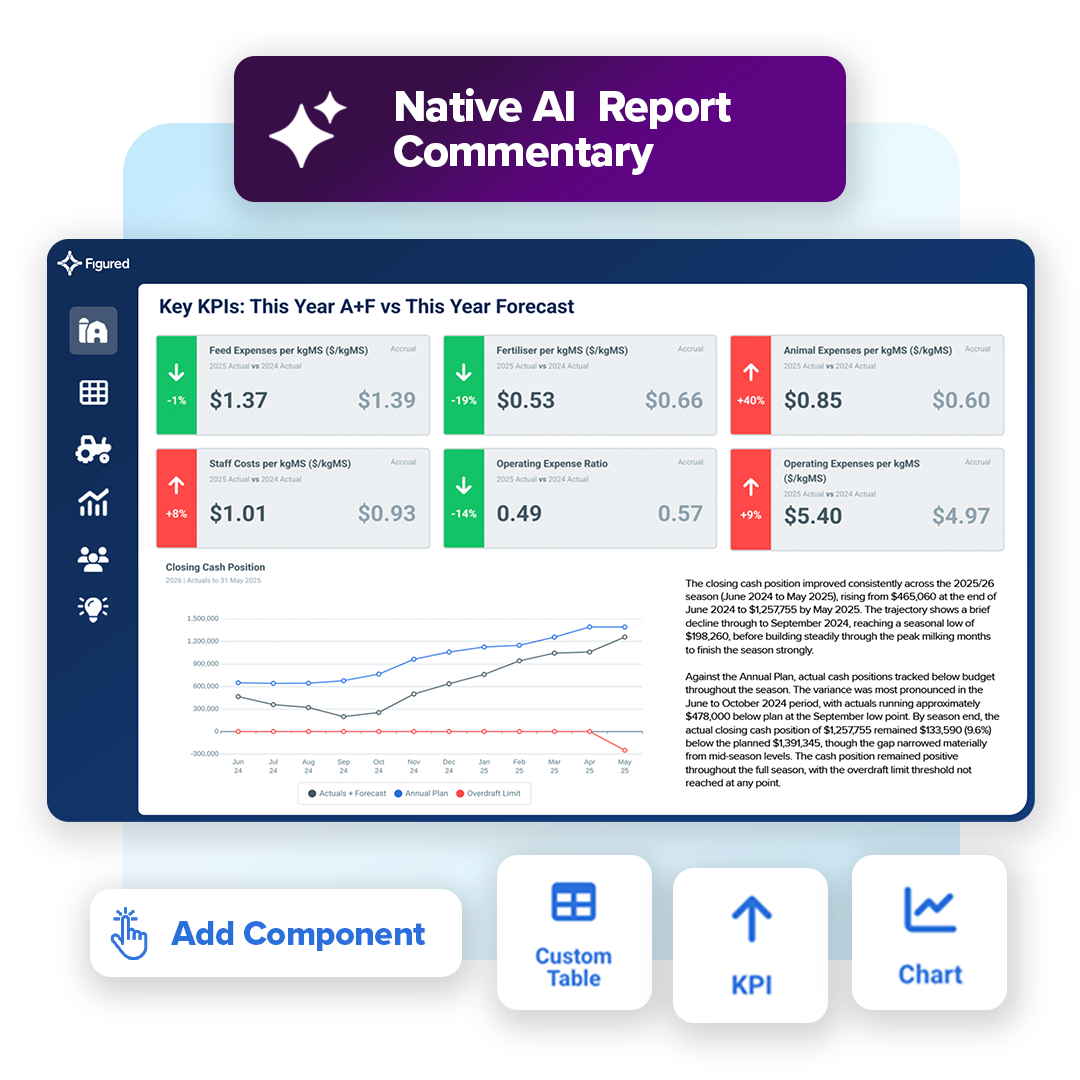
Plus, Figured’s powerful custom report builder, Reporting Studio, expands what you can do with reporting. Build fully tailored, highly visual report templates at the organisation level, then open them at the farm level and watch as the data populates automatically. Auto Analyst even writes the commentary for you.

You’ll be able to scale to-the-minute, accurate, detailed reports to more clients than ever before, expanding your advisory offering and sparking better conversations when they’re needed.

Explore Reporting
Product Image - Square Block - Planning Grid

Benchmarking

Production Performance Compared Across Your Whole Client Book

For Figured Insights users, your clients’ production data goes even further. Build custom benchmark pools from your whole client book, filtered by ownership structure, region, or production system, then see how each client is doing compared to their peers. If a farm’s cost of production sits outside of its group, you’ve got a reason to pick up the phone.

For dairy accountants specifically, the Figured Dairy Benchmark Report also adds verified actuals from 2,000+ NZ dairy farms, with current-season data arriving months ahead of any other NZ source.

Explore Benchmarking
product-image-square-reporting

Knowing What’s Happening On-Farm Before a Call Changes What You Can Offer Clients

See how Figured gives you that visibility — book a free demo with our team.
Book a Demo

We’re all spending money to try to make money, and that is definitely where Xero and Figured come in as a very integral tool for our business — so that we are constantly looking forward, not backwards.

Jarod Creed
Jarod Creed JC Ag Financial Services

Figured is an online cloud tool that enables clients to plan their cashflow scenario planning for one to five years into the future. Its ability to look at profitability on the farm and not just focus on cash gives a great understanding about how the business is performing.

Mark Edwards
Mark Edwards Murray Nankivell

We think Figured is a great tool for the financial management reporting side of things. It allows the opportunity for us to help clients establish a great structure around their financial reporting system that actually gives them meaningful information out the other end.

Nicolette Vaughan
Nicolette Vaughan PrincipleFocus

Integrations

Figured Works with the Software You Already Use

Figured doesn't replace your existing software — it plugs in on top, pulling live data from Xero, QuickBooks Online, or MYOB, and integrates with the apps you already use to manage the farm.

Bronze Partner

Join the Figured Partner Program

Earn recognition for the advisory work you’re already doing — and get found by the farming clients looking for an adviser who knows Figured.

figured-partners

Questions

Production Management in Figured — FAQ

Figured supports production tracking for dairy, livestock, cropping, and mixed farming operations.

Accountants can set their clients up with a variety of trackers designed specifically for each major farm type in New Zealand. For example, the Milk Tracker is built to capture monthly kgMS figures. The Livestock Tracker records stock movements. The Crop Tracker handles seasonal activity down to the field and crop type level. Plus Inventory Trackers help you track stock on hand and create valuations based on current data.

From here, production quantities across all farm types connect directly to the year’s budget and live cashflow data from Xero, MYOB, or QuickBooks Online, linking on-farm activity to real financial performance in one platform.

In Figured, budgets are built in the Planning Grid as month-by-month financial plans that bring together production quantities (from your various trackers) plus income and cost.

During the year, as your various production trackers are updated, the data feeds immediately back into the Planning Grid, transforming forecasts into actuals in the same view. Accountants can see where production is tracking against the budget at any point in the season, with the financial impact of any variance already visible in the plan.

Then, when it comes time to create next year’s budget, it’s easy to rollover the prior year’s actuals so you’re not building from scratch.

Many farmers around New Zealand have their data sync automatically from the production apps they use each day — like AgriWebb, FarmIQ, Trev, or Agworld.

Figured also syncs with a variety of other key data streams, like major milk processors, meat processors, and even the IRD.

Where an integration isn’t available or supported, data can still be entered manually — something which is considerably simpler in Figured than maintaining old spreadsheets or paper records. Once a number’s in Figured, it flows through to the Planning Grid and updates the financial plan automatically, keeping the production and financial pictures current in the same step.

Yes. Figured supports clients with multiple farms under the same practice relationship, each with its own production trackers, financial plan, and reporting.

For mixed-enterprise farms with both livestock and cropping activity, Figured tracks both enterprise types in a single farm file, and production quantities from each connect to the relevant part of the financial plan.

Where a client also runs non-farming commercial entities alongside the farming operation, Commercial Manager handles those within the same platform. The consolidated picture stays current across the whole client relationship, not just the farming side.

The national benchmark report is available to firms with Figured Insights enabled.

Those users can access the national benchmark report directly in Reporting Studio under Custom Reports, which pulls the data from your eligible dairy clients’ files automatically.

For custom benchmark pools, head to the Benchmarking tab, add your farms, set your filters, and Figured builds the comparison. Figured fully anonymises and aggregates all benchmarking data, so no individual farm, firm, or client is identifiable.

Yes, we’ve worked hard to ensure that Auto Analyst, Reporting Studio’s AI commentary feature, is completely accurate to your farm numbers, and is safe to use. Within Reporting Studio, Figured calculates every figure, variance, and ratio before Auto Analyst sees anything. The AI’s job is to describe those numbers in writing. A separate checking layer then reads the write-up back against the underlying data and corrects anything that doesn’t reconcile, which minimises the risk of an inaccurate statement reaching the page. On the data security side, Figured AI works only with what’s in your Figured account. It doesn’t browse the web or pull in outside sources. When Auto Analyst writes commentary for you, Figured sends the relevant data to a model provider for processing, and doesn’t retain the request or the response afterwards. /en-nz/security

See How Great Farm Data Changes Advisory Conversations

Figured is the platform for NZ agri accountants who are tired of reconciling the aftermath of a season, and want to get ahead of it.