.svg)
Client Portfolio Modelling & Dairy Benchmarking for Agri Accountants
Discover what’s happening across your full portfolio at once. See your top performers, who’s most exposed, and which clients need you — before they call.
Discover what’s happening across your full portfolio at once. See your top performers, who’s most exposed, and which clients need you — before they call.
The World’s Largest Farm Financial Management Platform
There’s a reason thousands of agri-accounting firms across New Zealand, Australia, the UK, and the USA run their farming clients through Figured. More than 35,000 farms trust the platform — and the advisers who use it every day know exactly why.









-modified.png)







![2015 Leech and Partners Master_CMYK[1]](https://www.figured.com/hubfs/Website%20Images/logos/customers/2015-leech-and-partners-master_cmyk-1-nobg-64456257.png)



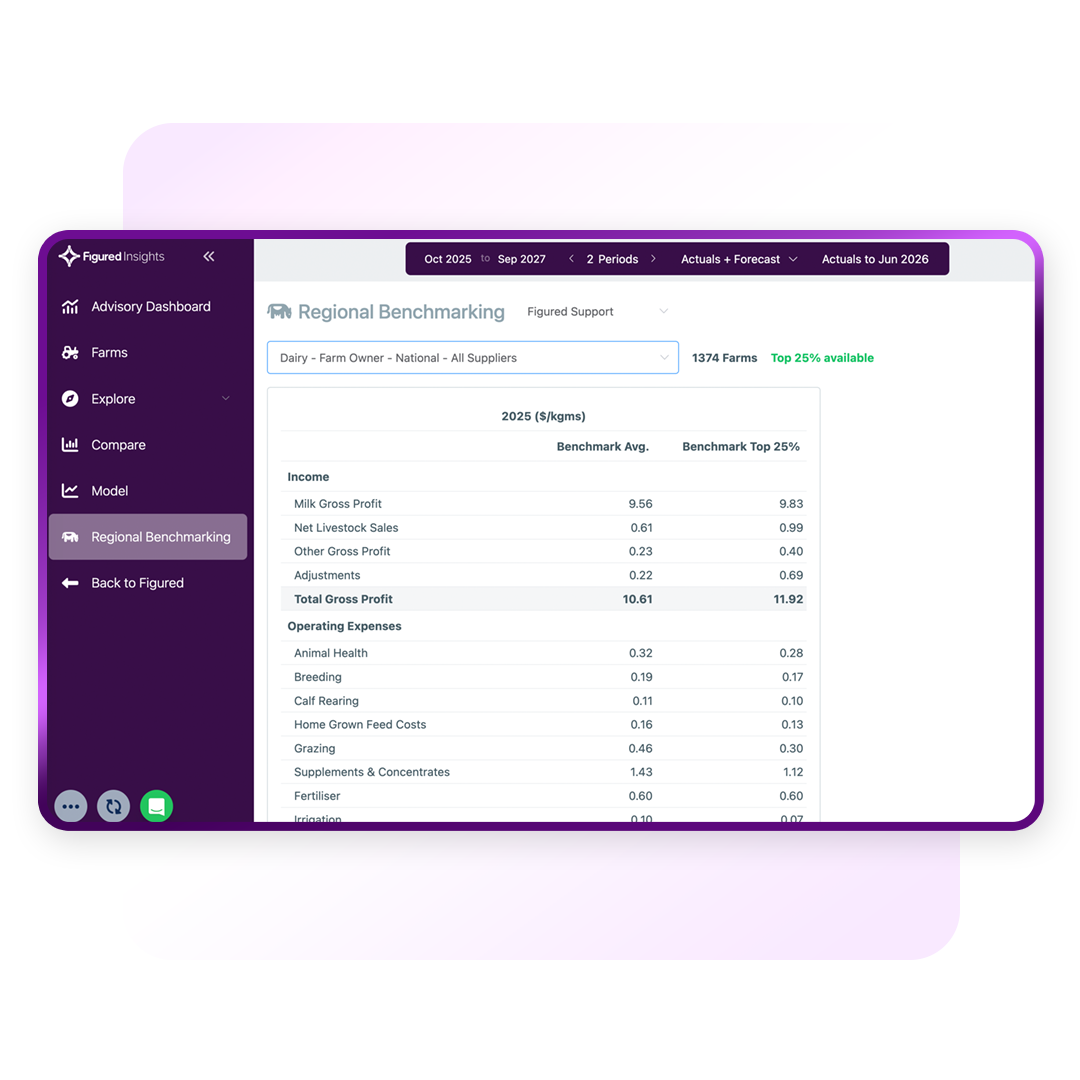
Dairy Benchmarking
Show your dairy clients where their season sits against their peers, drawn from over 2,000 verified NZ dairy farms filtered by region, ownership type, and supplier. In Figured Insights, current-season data arrives over a year ahead of any other NZ source.
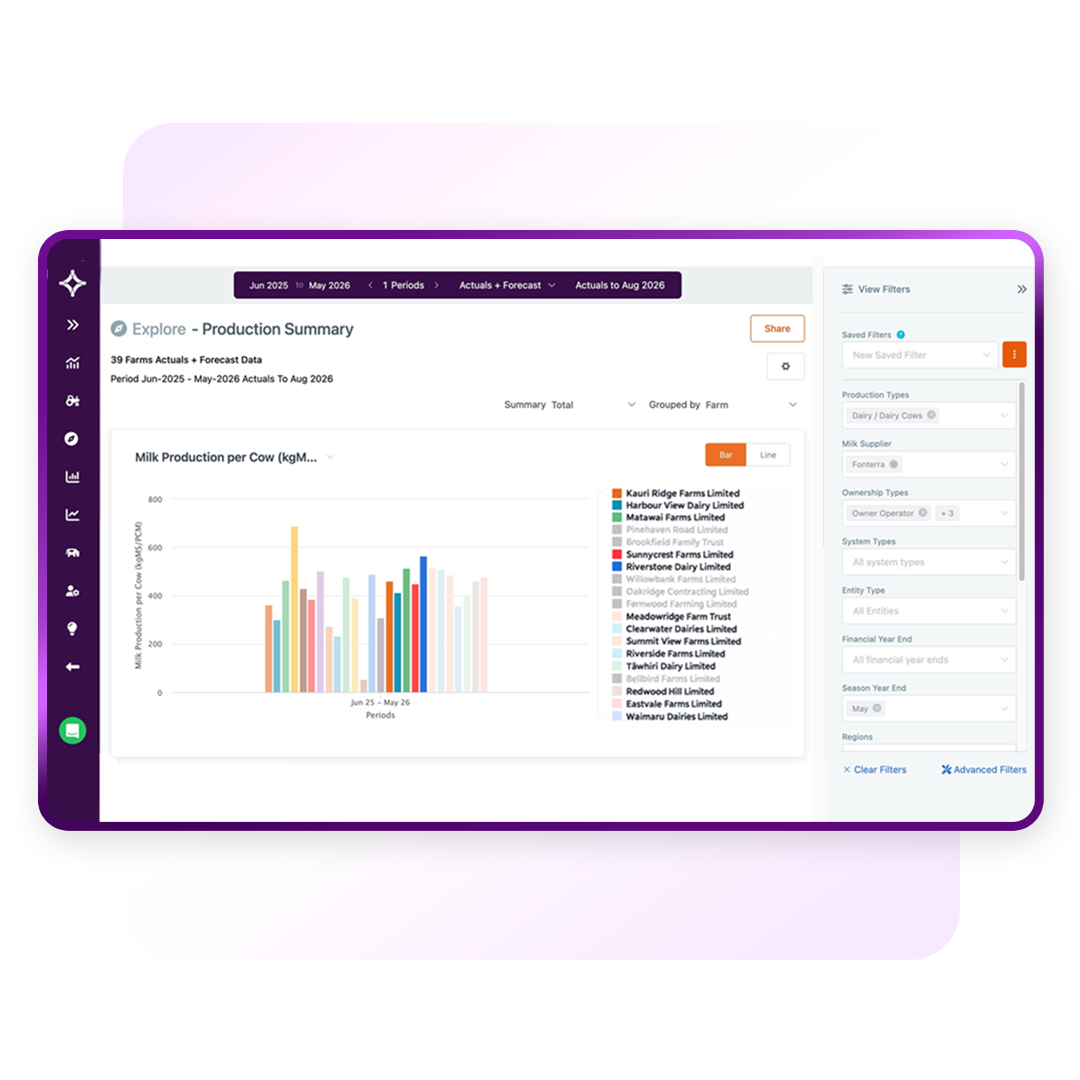
Portfolio Analytics
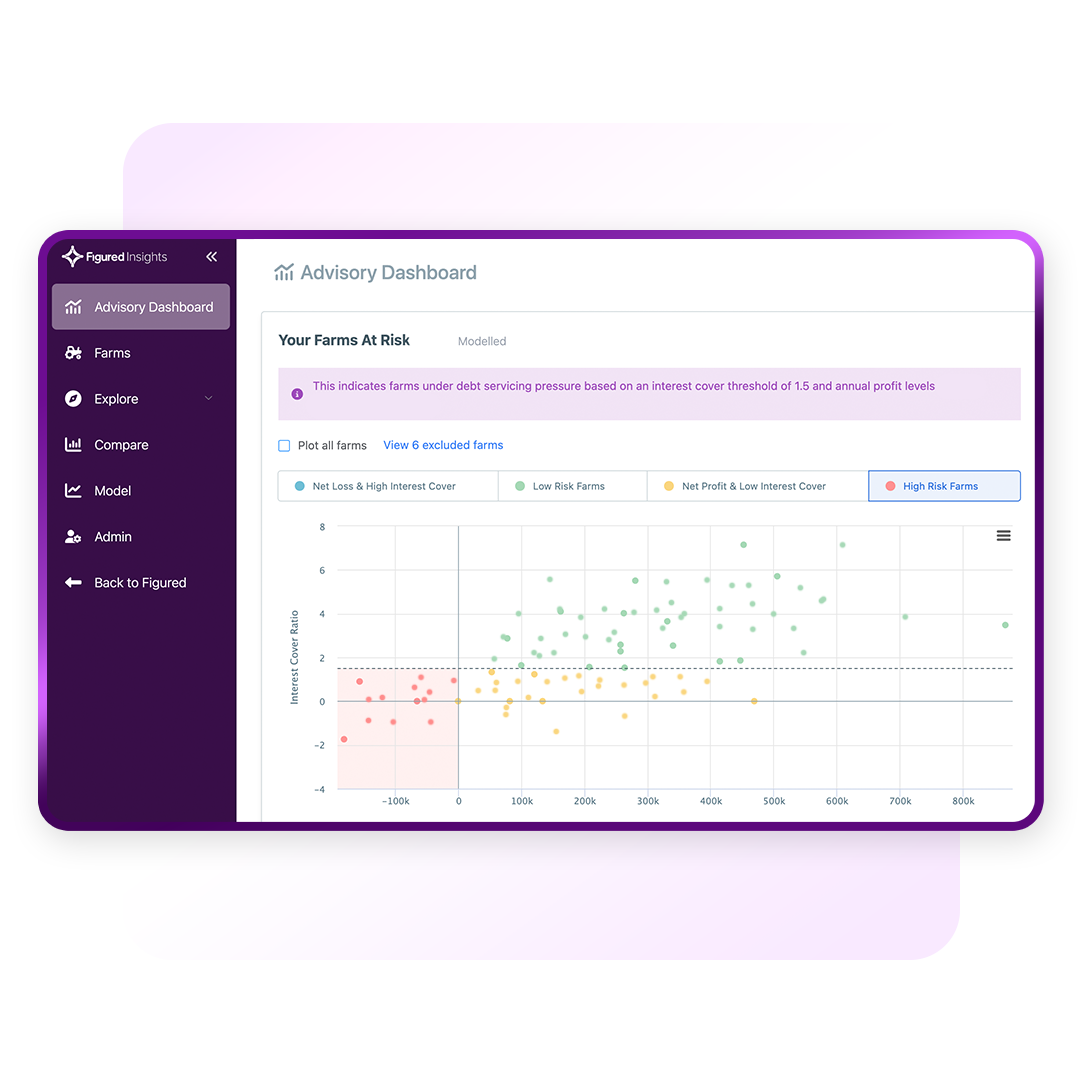
Figured Insights pulls financial and production data from every farm in your organisation into a single dashboard. Segment your client book by region, farm type, or custom grouping, then track key ratios and performance metrics across the whole portfolio in a few clicks.
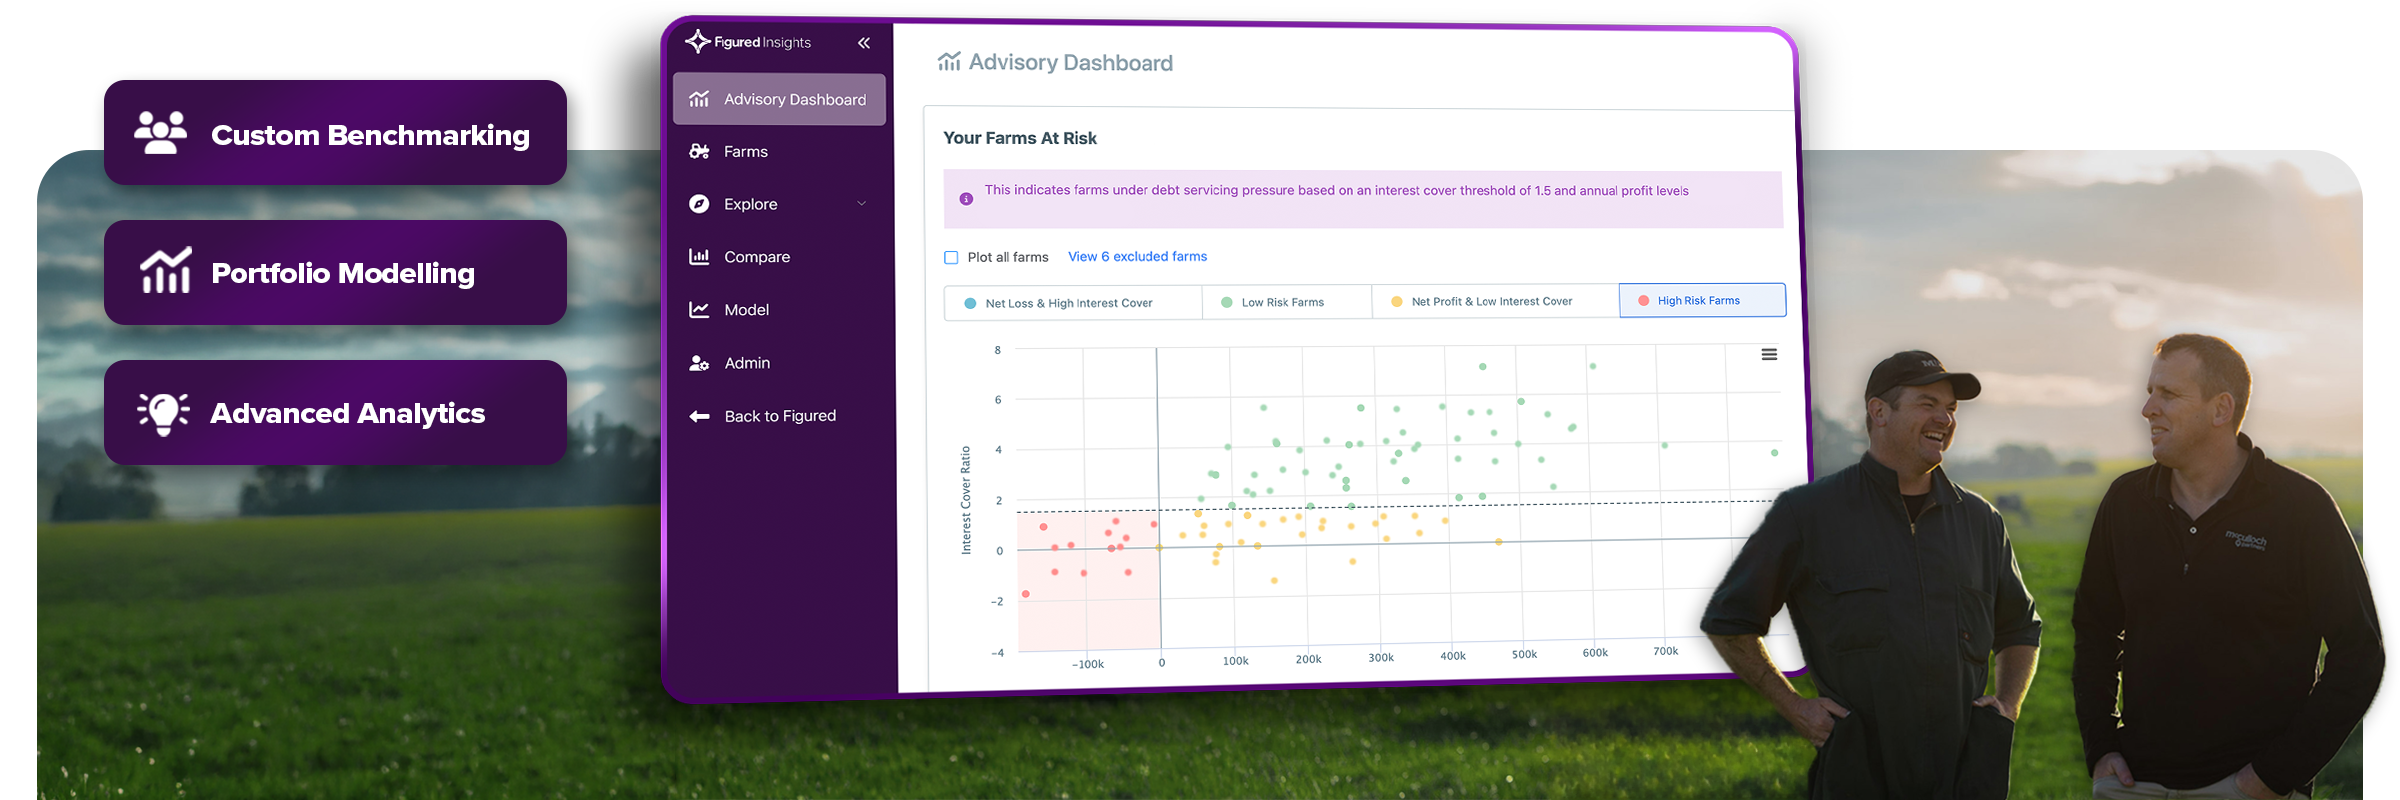
Custom Benchmarking
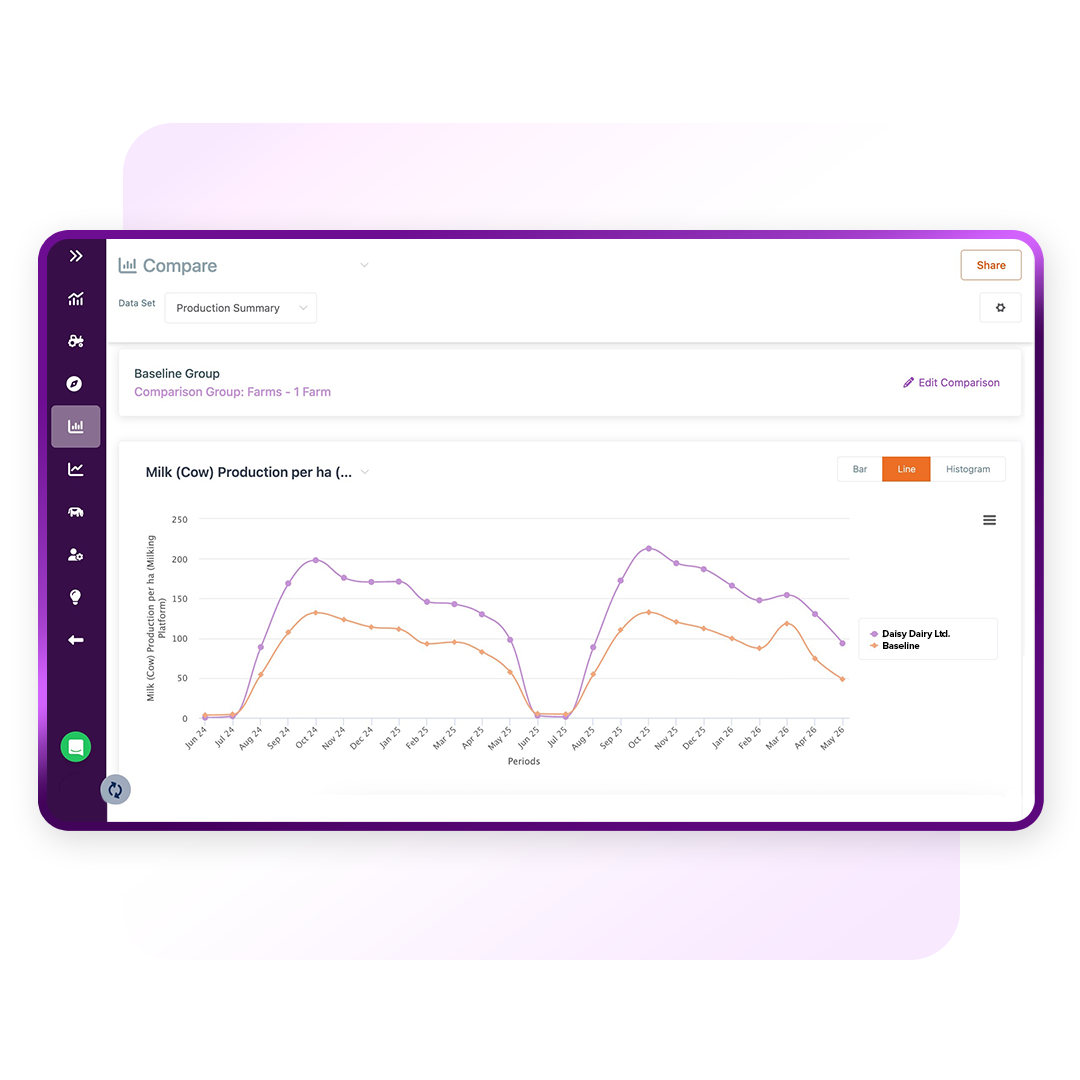
Discover which clients are outperforming their peers, and which are lagging, before the season ends. In Figured Insights, you can build comparison pools from farms within your portfolio, filtered by ownership structure, region, or production system, and compare their financial and production performance directly.
Portfolio Modelling
Adjust key variables including milk prices, livestock schedules, or operating costs to see the modelled impact on financial metrics across your entire portfolio simultaneously. Identify which clients carry the most exposure before market changes arrive, and direct your outreach accordingly.

Track performance per unit: $/kgMS, $/peak cow, $/hA, and $/SU, so farms of different scales compare meaningfully across your portfolio.

Every farm carries a quality score. Know which client data is reliable before you run your analysis or share a benchmark.

Sync directly from the rest of Figured so that your portfolio data is standardised and current, with no manual uploads or IT configuration required.

Use AI to map every farm’s chart of accounts into standardised categories automatically, so your benchmark comparisons stay apples-to-apples even when two clients’ books are set up completely differently.
The comparisons tool positions any farm against a baseline distribution using a histogram. See where a client sits compared to the average.

Build your benchmark report layout once at the organisation level and run it consistently across every eligible dairy farm in your practice.
Figured connects monthly kgMS from NZ’s major milk processors, and bank feeds to each client’s budget automatically, with milk price scenario planning and sharemilker arrangement support built in. The Dairy Benchmark Report then adds an additional layer, allowing you to compare that same performance to thousands of other dairy farms.
Use the portfolio analytics dashboard to see how all your dairy clients are tracking, and the Benchmark Report to show each of them how they compare to their regional peers.
Figured was built to create smooth livestock planning workflows. Herd Scheme and National Standard Cost valuations update automatically each year, stock movements connect to the financial plan through integrations with apps like AgriWebb, FarmIQ, and Trev, and class-by-class reconciliation keeps records current.
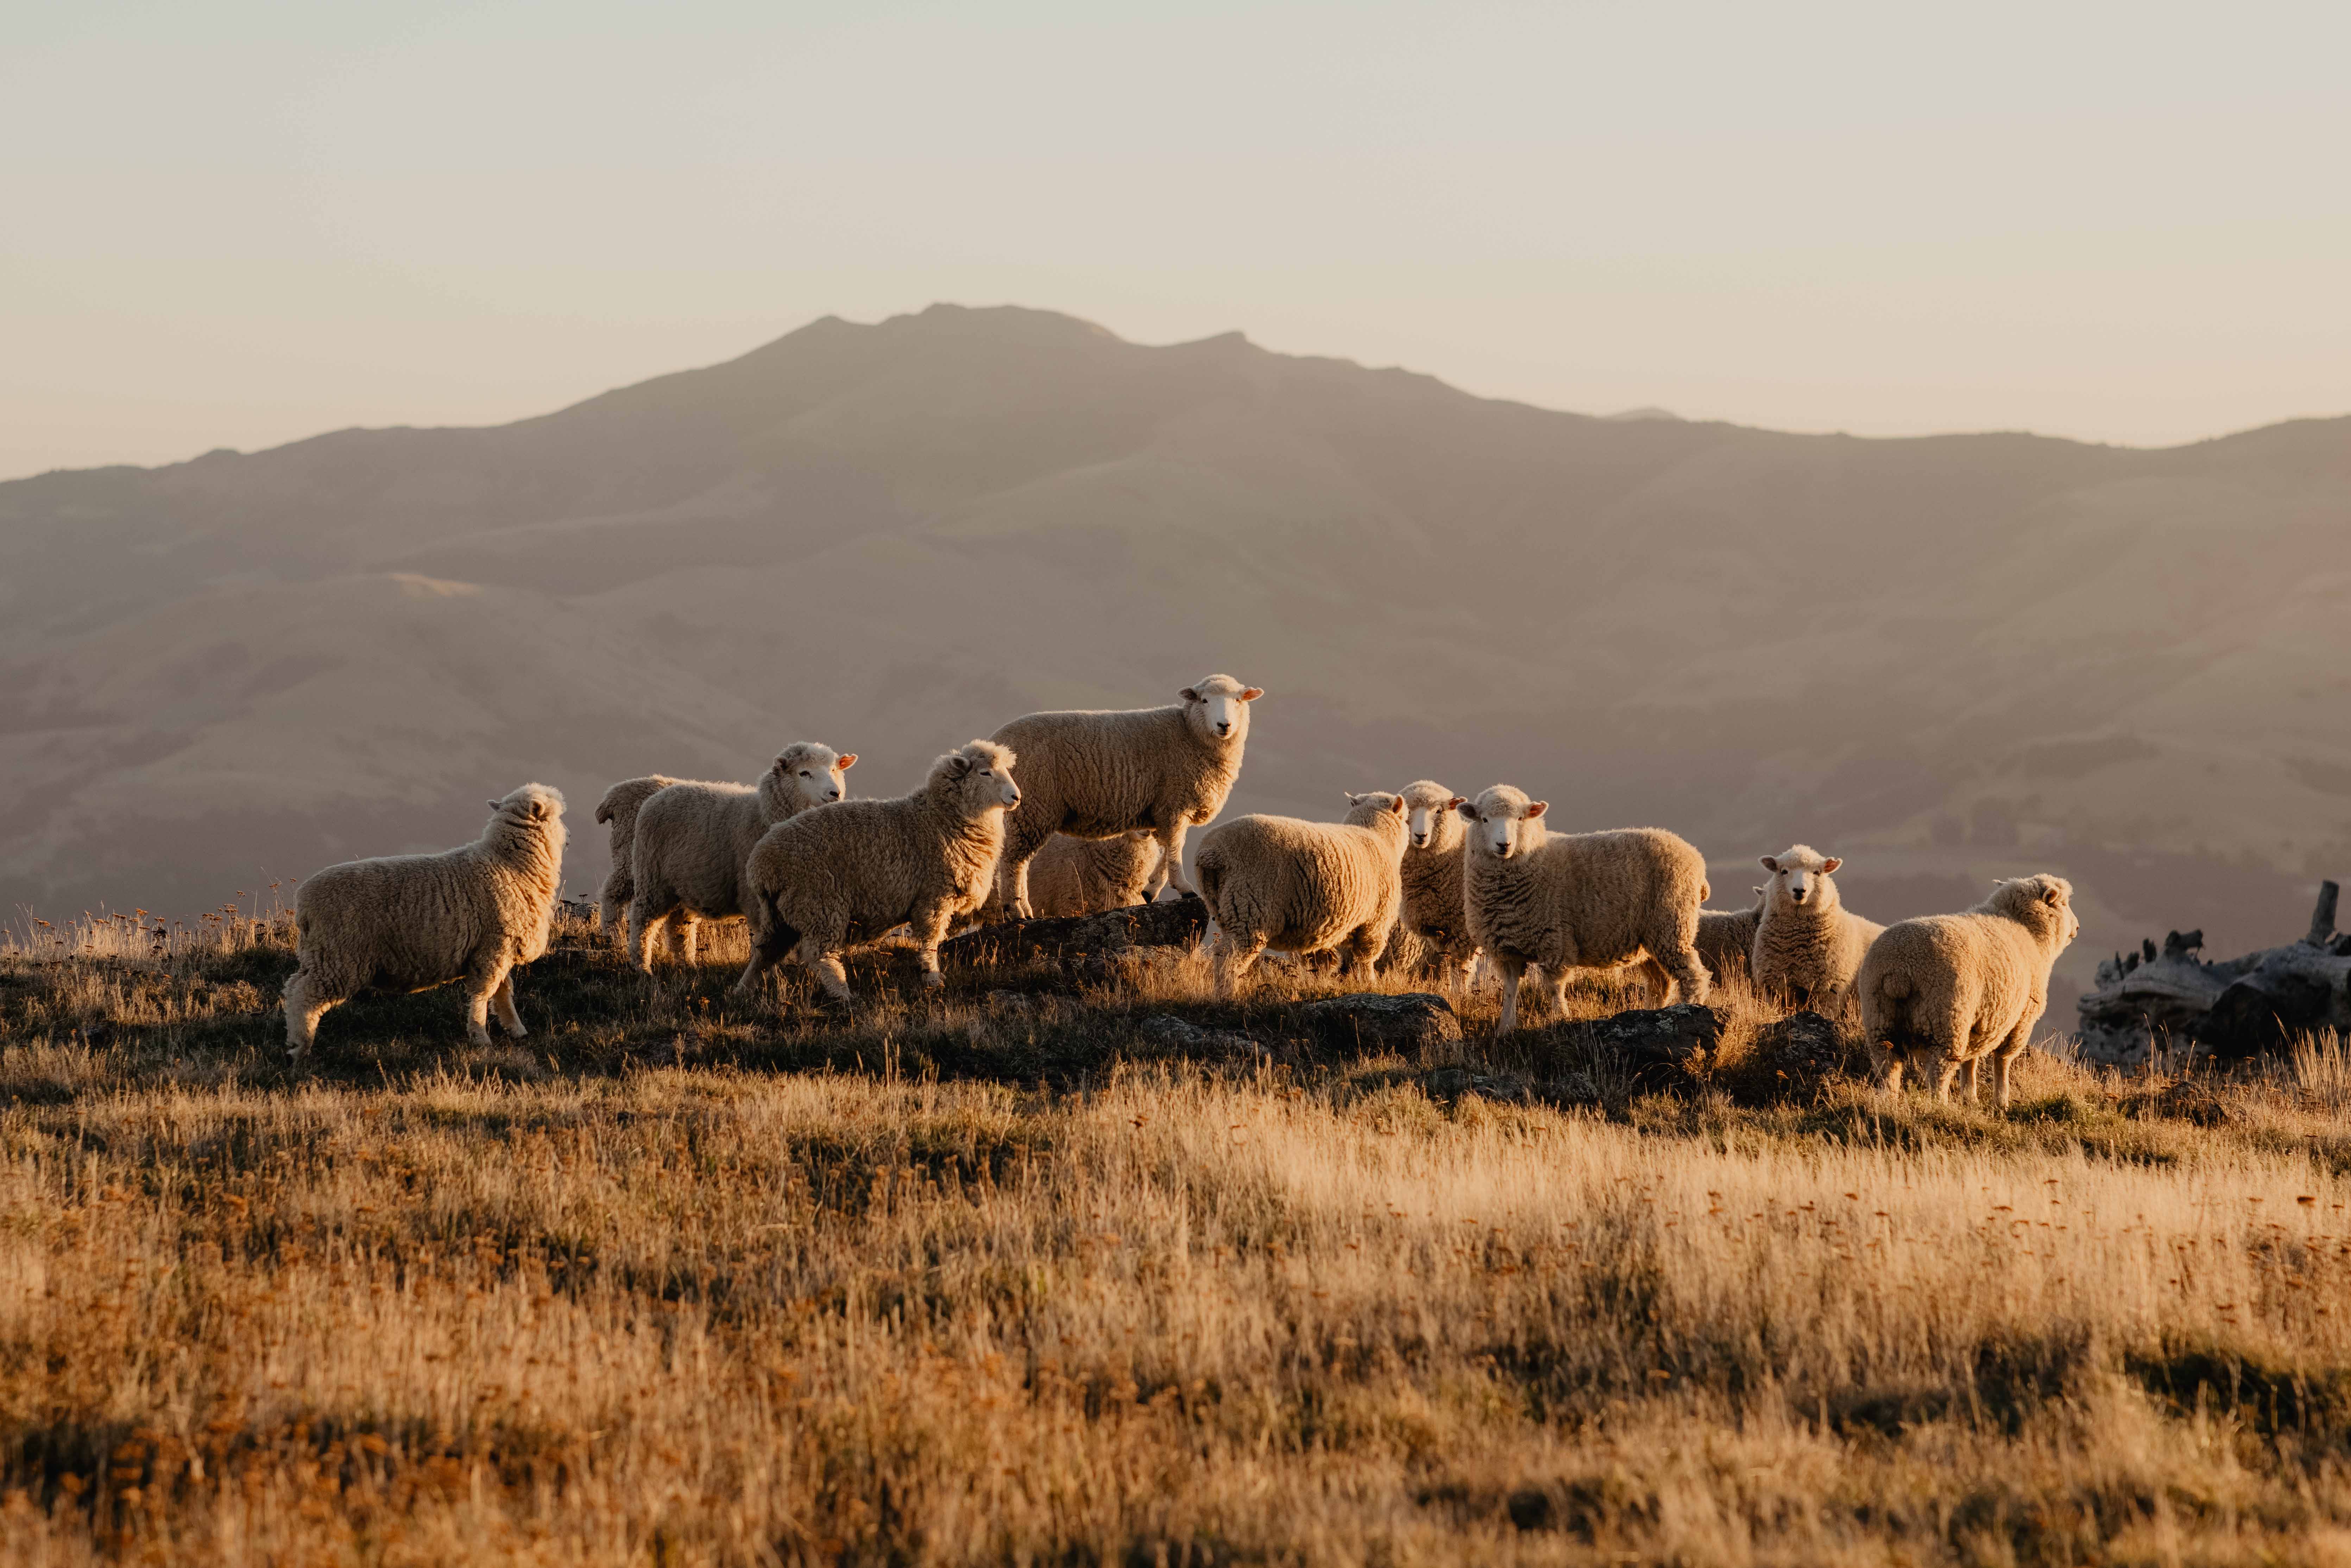
Figured gives NZ cropping accountants crop-level gross margin reporting, seasonal cashflow planning from sowing to sale, and scenario modelling for input cost and commodity price changes. The Crop Tracker connects production planning to the financial picture throughout the season, so the model stays current without rebuilding from scratch each time conditions change.

Many accounting and advisory clients aren’t farming operations — some are commercial entities alongside a farm, or completely separate non-farm businesses in their own right.
Commercial Manager extends Figured’s capability to all of your non-farming entities, giving your practice one platform for every client relationship.
Trusted by New Zealand Farm Teams


By mapping out what you’re doing on Figured, you can see: right, I’m doing this, this is the result, this is our feed inputs, this is the output from the cows. I use Figured probably too much — I use it a lot, I log in on my phone a lot. It’s an awesome tool for me to road map our year.
Figured is an online cloud tool that enables clients to plan their cashflow scenario planning for one to five years into the future. Its ability to look at profitability on the farm and not just focus on cash gives a great understanding about how the business is performing.

We think Figured is a great tool for the financial management reporting side of things. It allows the opportunity for us to help clients establish a great structure around their financial reporting system that actually gives them meaningful information out the other end.

Integrations
Figured doesn't replace your existing software — it plugs in on top, pulling live data from Xero, QuickBooks Online, or MYOB, and integrates with the apps you already use to manage the farm.
Full farm financial management — planning, budgeting, forecasting, and compliance in one place.
Learn More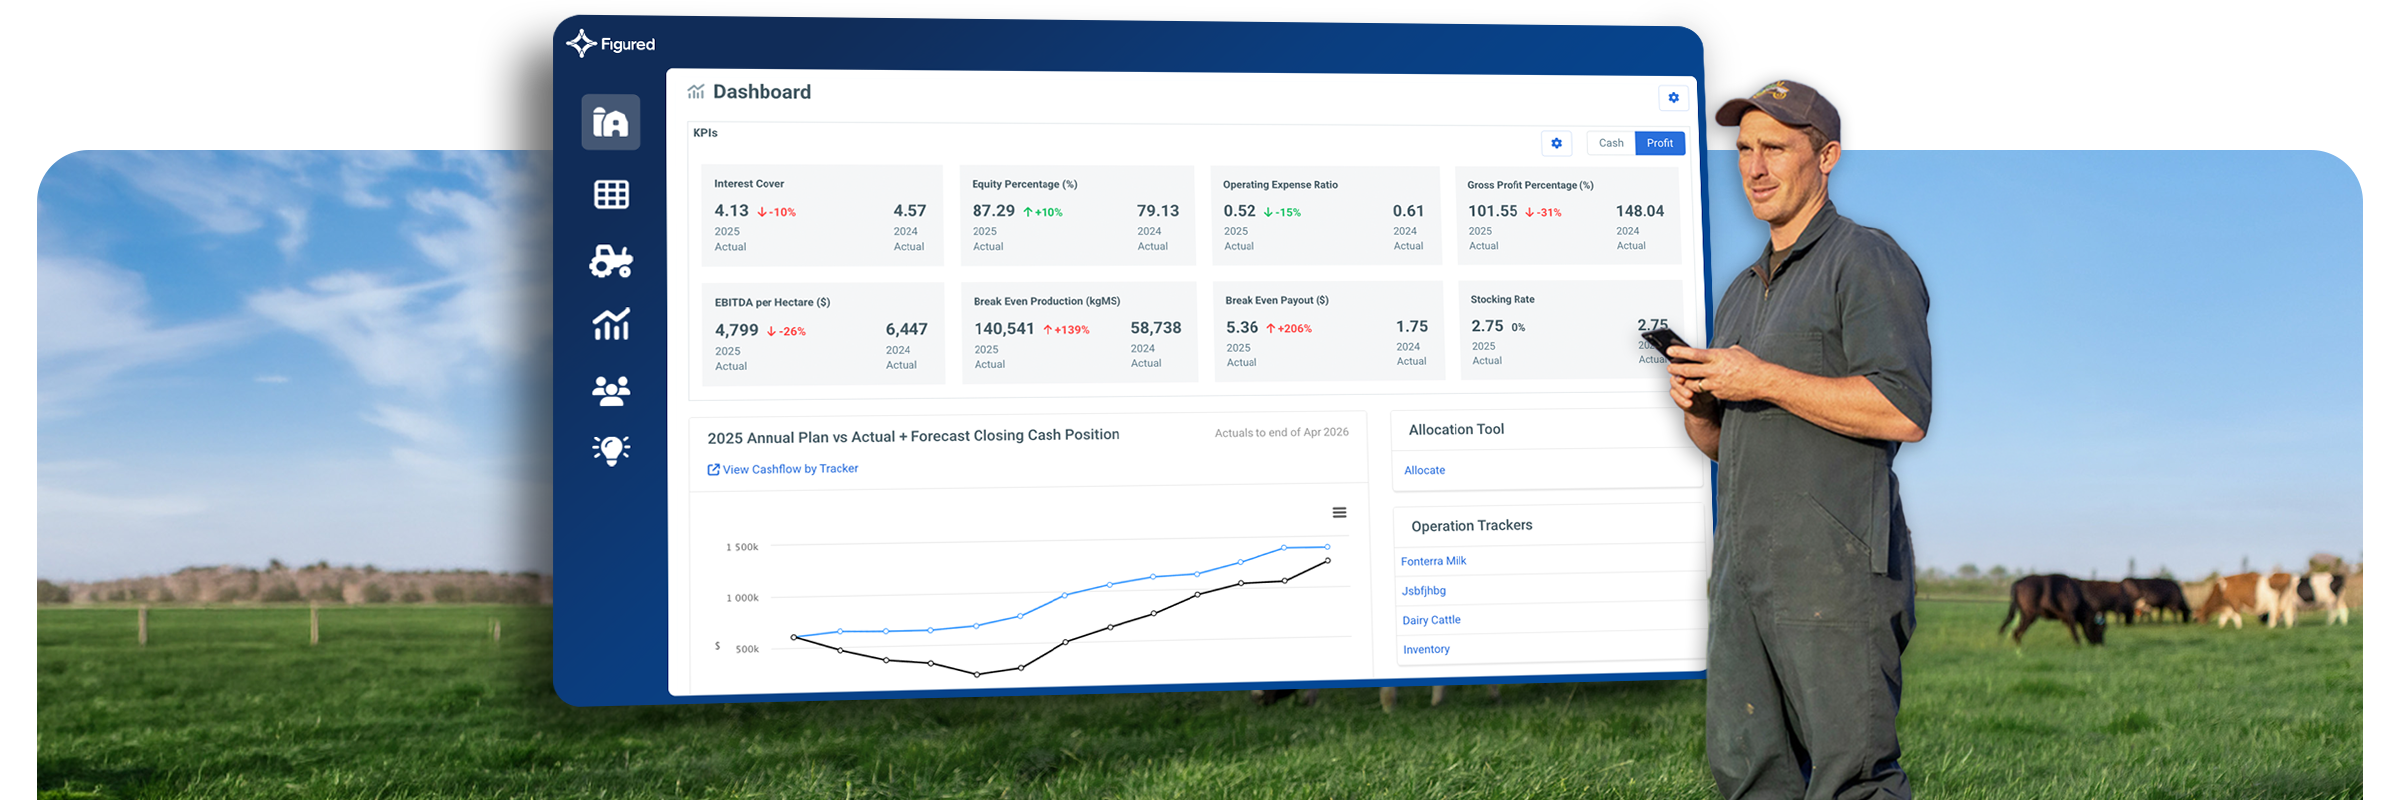
Farm reporting built on live data. For clients who need performance reporting without the full planning layer.
Learn More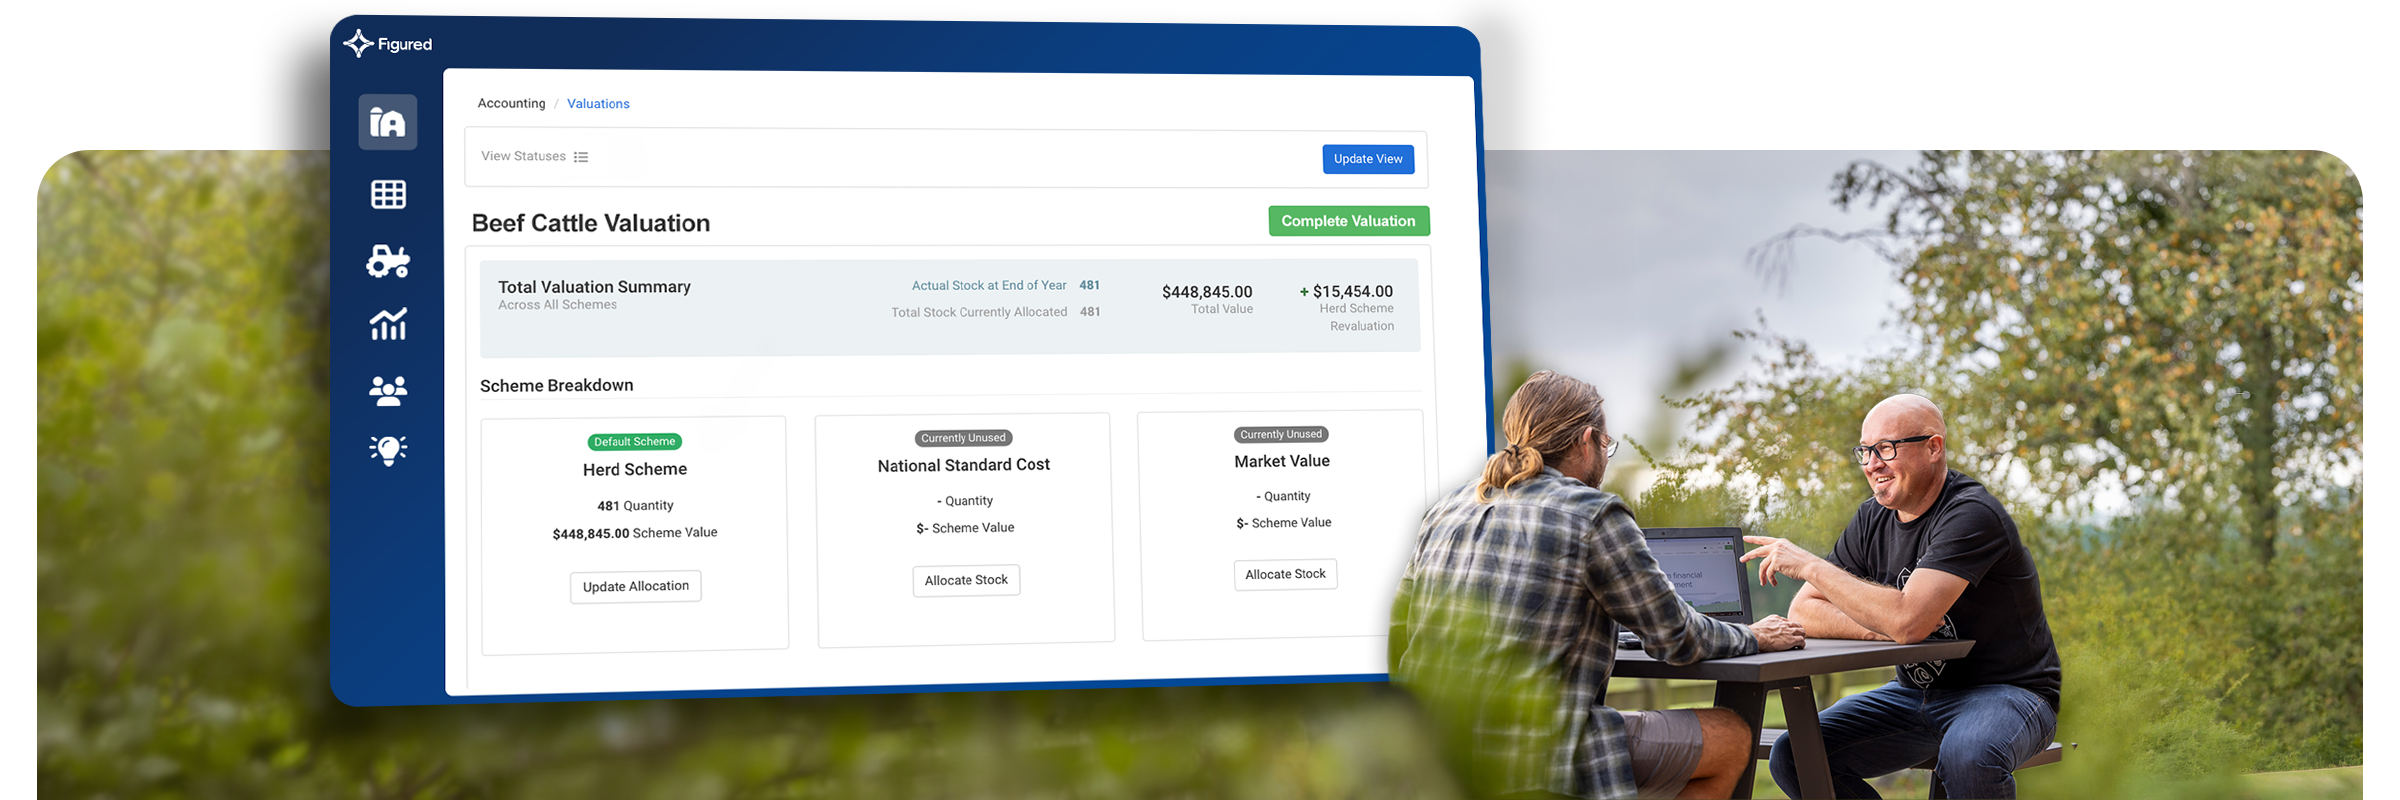
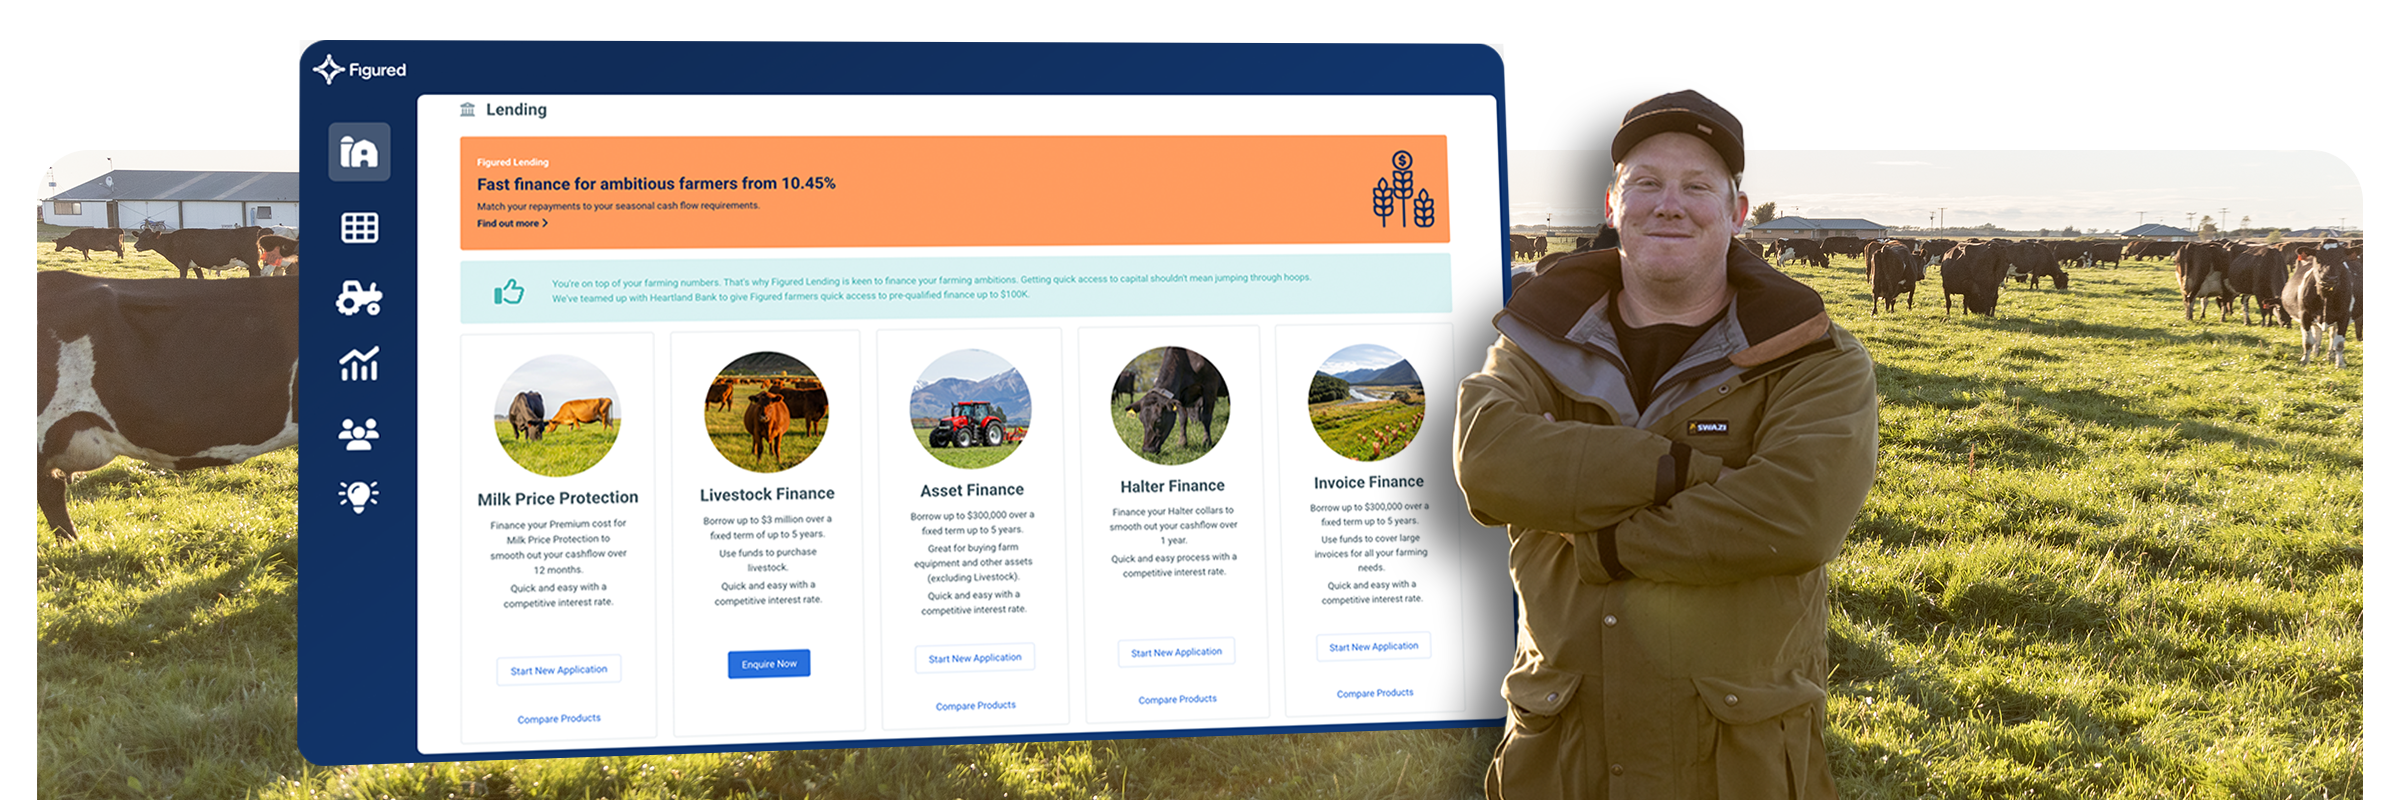
Farm-specific lending services and Milk Price Protection delivered through the Figured platform.
Learn More